Shutterfly 2009 Annual Report Download - page 55
Download and view the complete annual report
Please find page 55 of the 2009 Shutterfly annual report below. You can navigate through the pages in the report by either clicking on the pages listed below, or by using the keyword search tool below to find specific information within the annual report.-
 1
1 -
2
-
3
-
4
-
5
-
6
-
7
-
8
-
9
-
10
-
11
-
12
-
13
-
14
-
15
-
16
-
17
-
18
-
19
-
20
-
21
-
22
-
23
-
24
-
25
-
26
-
27
-
28
-
29
-
30
-
31
-
32
-
33
-
34
-
35
-
36
-
37
-
38
-
39
-
40
-
41
-
42
-
43
-
44
-
 45
45 -
 46
46 -
 47
47 -
 48
48 -
 49
49 -
 50
50 -
 51
51 -
 52
52 -
 53
53 -
 54
54 -
 55
55 -
 56
56 -
 57
57 -
 58
58 -
 59
59 -
 60
60 -
 61
61 -
 62
62 -
 63
63 -
 64
64 -
 65
65 -
66
-
67
-
68
-
69
-
70
-
71
-
72
-
73
-
74
-
75
-
76
-
77
-
78
-
79
-
80
-
81
-
82
-
83
-
84
-
85
-
86
-
87
-
88
-
89
-
90
-
91
-
92
-
93
-
94
-
95
-
96
-
97
-
98
-
99
-
100
-
101
-
102
-
103
-
104
-
105
-
106
-
107
-
108
-
109
-
110
-
111
-
112
-
113
-
114
-
115
-
116
-
117
-
118
-
119
-
120
-
121
-
122
-
123
-
124
-
125
-
126
-
127
-
128
-
129
-
130
-
131
 |
 |

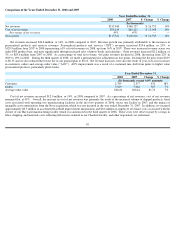
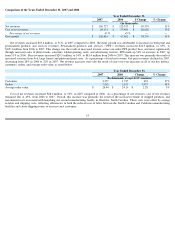
Comparison of the Years Ended December 31, 2007 and 2006
Net revenues increased $63.4 million, or 51%, in 2007 compared to 2006. Revenue growth was attributable to increases in both print and
personalized products and services revenues. Personalized products and services (“PPS”)
revenues increased $42.9 million, or 69%, to
$105.3 million from 2006 to 2007. This change was the result of increased revenue across our entire PPS product base, and most significantly
through increased sales of photo books, calendars, folded greeting cards, and advertising revenue. PPS made up 56% of revenues in 2007, up
from 51% in 2006. Print revenues increased $20.5 million, or 34%, to $81.4 million from 2006 to 2007. This increase was primarily the result of
increased revenues from 4x6, large format and photocard print sizes. As a percentage of total net revenue, 4x6 print revenues declined in 2007,
decreasing from 28% in 2006 to 22% in 2007. Net revenue increases were also the result of year-over-
year increases in all of our key metrics:
customers, orders, and average order value, as noted below:
Cost of net revenues increased $28.6 million, or 52%, in 2007 compared to 2006. As a percentage of net revenues, cost of net revenues
remained flat, at 45%, from 2006 to 2007. Overall, this increase was primarily the result of the increased volume of shipped products, and
incremental costs associated with launching our second manufacturing facility in Charlotte, North Carolina. These costs were offset by savings
in labor and shipping costs, reflecting efficiencies in both the reduced cost of labor between the North Carolina and California manufacturing
facilities and closer shipping routes to our east coast customers.
Year Ended December 31,
2007
2006
$ Change
% Change
(In thousands)
Net revenues
$
186,727
$
123,353
$
63,374
51
%
Cost of net revenues
$
84,111
$
55,491
$
28,620
52
%
Percentage of net revenues
45
%
45
%
—
—
Gross profit
$
102,616
$
67,862
$
34,754
51
%
Year Ended December 31,
2007
2006
Change
% Change
(In thousands, except AOV amounts)
Customers
2,357
1,725
632
37
%
Orders
7,062
5,105
1,957
38
%
Average order value
$
26.44
$
24.16
$
2.28
9
%
53