Shutterfly 2009 Annual Report Download - page 43
Download and view the complete annual report
Please find page 43 of the 2009 Shutterfly annual report below. You can navigate through the pages in the report by either clicking on the pages listed below, or by using the keyword search tool below to find specific information within the annual report.-
 1
1 -
2
-
3
-
4
-
5
-
6
-
7
-
8
-
9
-
10
-
11
-
12
-
13
-
14
-
15
-
16
-
17
-
18
-
19
-
20
-
21
-
22
-
23
-
24
-
25
-
26
-
27
-
28
-
29
-
30
-
31
-
32
-
 33
33 -
 34
34 -
 35
35 -
 36
36 -
 37
37 -
 38
38 -
 39
39 -
 40
40 -
 41
41 -
 42
42 -
 43
43 -
 44
44 -
 45
45 -
 46
46 -
 47
47 -
 48
48 -
 49
49 -
 50
50 -
 51
51 -
 52
52 -
 53
53 -
54
-
55
-
56
-
57
-
58
-
59
-
60
-
61
-
62
-
63
-
64
-
65
-
66
-
67
-
68
-
69
-
70
-
71
-
72
-
73
-
74
-
75
-
76
-
77
-
78
-
79
-
80
-
81
-
82
-
83
-
84
-
85
-
86
-
87
-
88
-
89
-
90
-
91
-
92
-
93
-
94
-
95
-
96
-
97
-
98
-
99
-
100
-
101
-
102
-
103
-
104
-
105
-
106
-
107
-
108
-
109
-
110
-
111
-
112
-
113
-
114
-
115
-
116
-
117
-
118
-
119
-
120
-
121
-
122
-
123
-
124
-
125
-
126
-
127
-
128
-
129
-
130
-
131
 |
 |

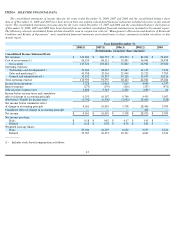
ITEM 6. SELECTED FINANCIAL DATA.
The consolidated statements of income data for the years ended December 31,
2008, 2007 and 2006 and the consolidated balance sheet
data as of December 31, 2008 and 2007 have been derived from our audited consolidated financial statements
included elsewhere in this annual
report. The consolidated statements of income data for the years ended December 31, 2005 and 2004 and the consolidated balance
sheet data as
of December 31, 2006, 2005 and 2004 have been derived from our
audited consolidated financial statements not included in this annual report.
The following selected consolidated financial data should be read in conjunction with our “Management’
s Discussion and Analysis of Financial
Condition and Results of Operations” and consolidated financial statements and related notes to those
statements included elsewhere in this
annual report.
__________
Year Ended December 31,
2008(3)
2007(3)
2006(3)
2005(2)
2004
(In thousands, except per share amounts)
Consolidated Income Statement Data:
Net revenues
$
213,480
$
186,727
$
123,353
$
83,902
$
54,499
Cost of net revenues(1)
96,159
84,111
55,491
36,941
24,878
Gross profit
117,321
102,616
67,862
46,961
29,621
Operating expenses:
Technology and development(1)
39,443
28,635
19,087
13,152
7,433
Sales and marketing(1)
41,958
33,363
21,940
15,252
7,705
General and administrative(1)
32,192
29,557
19,216
13,657
10,126
Total operating expense
113,593
91,555
60,243
42,061
25,264
Income from operations
3,728
11,061
7,619
4,900
4,357
Interest expense
(273
)
(179
)
(266
)
(367
)
(471
)
Other income (expense) net
2,898
5,515
2,387
(103
)
81
Income before income taxes and cumulative
effect of change in accounting principle
6,353
16,397
9,740
4,430
3,967
(Provision) / benefit for income taxes
(1,792
)
(6,302
)
(3,942
)
24,060
(258
)
Net income before cumulative effect
of change in accounting principle
4,561
10,095
5,798
28,490
3,709
Cumulative effect of change in accounting principle
—
—
—
442
—
Net income
$
4,561
$
10,095
$
5,798
$
28,932
$
3,709
Net income per share:
Basic
$
0.18
$
0.42
$
0.67
$
1.45
$
—
Diluted
$
0.18
$
0.38
$
0.56
$
1.02
$
—
Weighted Average Shares
Basic
25,036
24,295
8,622
3,255
2,231
Diluted
25,787
26,273
10,331
4,609
2,231
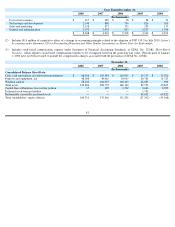
(1)
Includes stock
-
based compensation as follows:
41