Sharp 2015 Annual Report Download - page 51
Download and view the complete annual report
Please find page 51 of the 2015 Sharp annual report below. You can navigate through the pages in the report by either clicking on the pages listed below, or by using the keyword search tool below to find specific information within the annual report.-
 1
1 -
2
-
3
-
4
-
5
-
6
-
7
-
8
-
9
-
10
-
11
-
12
-
13
-
14
-
15
-
16
-
17
-
18
-
19
-
20
-
21
-
22
-
23
-
24
-
25
-
26
-
27
-
28
-
29
-
30
-
31
-
32
-
33
-
34
-
35
-
36
-
37
-
38
-
39
-
40
-
 41
41 -
 42
42 -
 43
43 -
 44
44 -
 45
45 -
 46
46 -
 47
47 -
 48
48 -
 49
49 -
 50
50 -
 51
51 -
 52
52 -
 53
53 -
 54
54 -
 55
55 -
 56
56 -
 57
57 -
 58
58 -
 59
59 -
 60
60
 |
 |

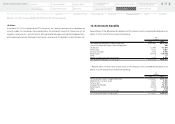
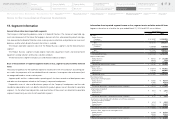
Related information
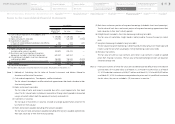
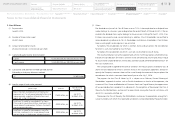
Sales by product/service for the years ended March 31, 2014 and 2015 were as follows:
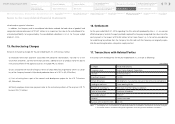
Sales by region/country for the years ended March 31, 2014 and 2015 were as follows:
Plant and Equipment by region/country as of March 31, 2014 and 2015 were as follows:
Yen
(millions)
2014 2015
Sales to outside customers:
LCDs ¥ 814,718 ¥ 772,997
LCD Color TVs 413,887 370,046
CCD/CMOS 213,997 334,672
Others 1,484,584 1,308,541
Total ¥ 2,927,186 ¥ 2,786,256
Yen
(millions)
2014 2015
Sales:
Japan ¥ 1,150,091 ¥ 968,449
China 925,348 1,140,892
U.S.A. 354,546 260,754
Others 497,201 416,161
Total ¥ 2,927,186 ¥ 2,786,256
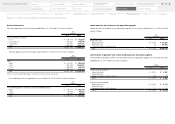
Yen
(millions)
2014 2015
Plant and Equipment, at cost less accumulated depreciation:
Japan ¥ 415,276 ¥ 305,936
China 38,785 48,023
Others 65,640 46,633
Total ¥ 519,701 ¥ 400,592
Sales are classified according to regions or countries where customers are located.
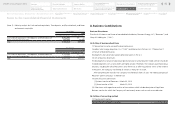
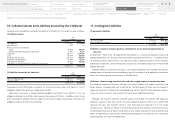
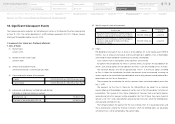
Impairment loss on fixed assets by reportable segment
Impairment loss on fixed assets by reportable segment for the years ended March 31, 2014 and 2015
were as follows:
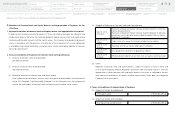
Amortization of goodwill and unamortized balance by reportable segment
Amortization of goodwill and the unamortized balance by reportable segment as of and for the years
ended March 31, 2014 and 2015 were as follows:
Yen
(millions)
2014 2015
Impairment Loss:
Product Business ¥ 11,742 ¥ 18,592
Device Business 28 85,423
Corporate Assets and Elimination — —
Total ¥ 11,770 ¥ 104,015
Yen
(millions)
2014 2015
Amortization of Goodwill:
Product Business ¥ 4,072 ¥ 2,542
Device Business — —
Corporate Assets and Elimination 65 11
Total ¥ 4,137 ¥ 2,553
Balance at end of period:
Product Business ¥ 11,092 ¥ 4,170
Device Business — —
Corporate Assets and Elimination 11 —
Total ¥ 11,103 ¥ 4,170
Notes to the Consolidated Financial Statements
49
Notes to the Consolidated
Financial Statements
Financial Section
Segment Outline
Medium-Term Management Plan
for Fiscal 2015 through 2017
Investor Information
Directors, Audit & Supervisory Board
Members and Executive Officers
Risk Factors
Corporate Governance
Contents
Corporate Social
Responsibility (CSR)
Message to our Shareholders
Fiscal 2014 Review by
Product Group
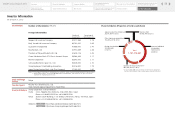
Financial Highlights
SHARP Annual Report 2015
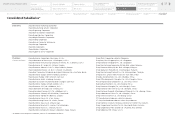
Consolidated
Subsidiaries
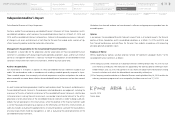
Independent Auditor’s
Report
Consolidated Statements of
Cash Flows
Consolidated Statements of
Changes in Net Assets
Consolidated Statements of
Comprehensive Income
Consolidated Statements of
Operations
Consolidated Balance Sheets
Financial Review
Five-Year Financial Summary