Sharp 2015 Annual Report Download - page 50
Download and view the complete annual report
Please find page 50 of the 2015 Sharp annual report below. You can navigate through the pages in the report by either clicking on the pages listed below, or by using the keyword search tool below to find specific information within the annual report.-
 1
1 -
2
-
3
-
4
-
5
-
6
-
7
-
8
-
9
-
10
-
11
-
12
-
13
-
14
-
15
-
16
-
17
-
18
-
19
-
20
-
21
-
22
-
23
-
24
-
25
-
26
-
27
-
28
-
29
-
30
-
31
-
32
-
33
-
34
-
35
-
36
-
37
-
38
-
39
-
 40
40 -
 41
41 -
 42
42 -
 43
43 -
 44
44 -
 45
45 -
 46
46 -
 47
47 -
 48
48 -
 49
49 -
 50
50 -
 51
51 -
 52
52 -
 53
53 -
 54
54 -
 55
55 -
 56
56 -
 57
57 -
 58
58 -
 59
59 -
 60
60
 |
 |

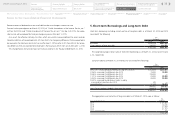
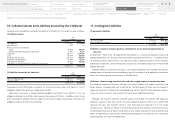
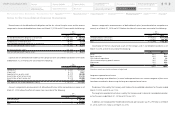
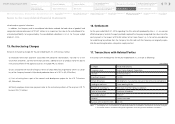
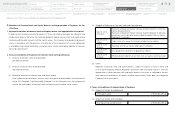
Adjustments of segment income or loss were ¥(33,095) million and ¥(37,040) million for the years
ended March 31, 2014 and 2015, respectively, and comprised elimination of intersegment transactions
and corporate expenses not allocated to each reportable segment.
The elimination of intersegment transactions was ¥228 million and ¥73 million, respectively. Corporate
expenses not allocated to each reportable segment were ¥(33,049) million and ¥(37,223) million for the
years ended March 31, 2014 and 2015, respectively.
Corporate expenses were mainly attributable to basic R&D expenses and expenses related to the ad-
ministrative groups of the Company’s headquarters.
Adjustments of segment assets were ¥615,997 million and ¥485,811 million as of March 31, 2014
and 2015, respectively, and comprised elimination of intersegment transactions and corporate assets not
allocated to each reportable segment.
The elimination of intersegment transactions was ¥(10,545) million and ¥(10,842) million, respectively.
Corporate assets not allocated to each reportable segment were ¥626,542 million and ¥496,653 million
as of March 31, 2014 and 2015, respectively.
Corporate assets not allocated to each reportable segment were attributable mainly to cash and cash
equivalents, the Company’s investments in securities, and depreciable assets related to the Company’s
R&D groups as well as the administrative, sales and distribution groups of the Company’s headquarters.
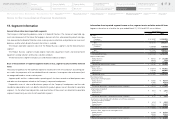
Adjustments of investments in nonconsolidated subsidiaries and affiliates accounted for using the
equity method were ¥28,310 million and ¥31,098 million as of March 31, 2014 and 2015, respectively,
and mainly comprised investments in Sharp Finance Corporation.
Adjustments of increase in plant, equipment and intangible assets were ¥6,308 million and ¥8,169
million for the years ended March 31, 2014 and 2015, respectively, and mainly comprised increase in
the Company’s R&D groups and the administrative, sales and distribution groups of the Company’s
headquarters.
Depreciation and amortization includes the amortization of long-term prepaid expenses.
Increase in plant, equipment and intangible assets includes the increase in long-term prepaid expenses.
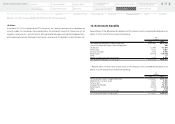
Notes to the Consolidated Financial Statements
48
Notes to the Consolidated
Financial Statements
Financial Section
Segment Outline
Medium-Term Management Plan
for Fiscal 2015 through 2017
Investor Information
Directors, Audit & Supervisory Board
Members and Executive Officers
Risk Factors
Corporate Governance
Contents
Corporate Social
Responsibility (CSR)
Message to our Shareholders
Fiscal 2014 Review by
Product Group
Financial Highlights
SHARP Annual Report 2015
Consolidated
Subsidiaries
Independent Auditor’s
Report
Consolidated Statements of
Cash Flows
Consolidated Statements of
Changes in Net Assets
Consolidated Statements of
Comprehensive Income
Consolidated Statements of
Operations
Consolidated Balance Sheets
Financial Review
Five-Year Financial Summary