Sharp 2015 Annual Report Download - page 4
Download and view the complete annual report
Please find page 4 of the 2015 Sharp annual report below. You can navigate through the pages in the report by either clicking on the pages listed below, or by using the keyword search tool below to find specific information within the annual report.-
 1
1 -
 2
2 -
 3
3 -
 4
4 -
 5
5 -
 6
6 -
 7
7 -
 8
8 -
 9
9 -
 10
10 -
 11
11 -
 12
12 -
 13
13 -
 14
14 -
 15
15 -
16
-
17
-
18
-
19
-
20
-
21
-
22
-
23
-
24
-
25
-
26
-
27
-
28
-
29
-
30
-
31
-
32
-
33
-
34
-
35
-
36
-
37
-
38
-
39
-
40
-
41
-
42
-
43
-
44
-
45
-
46
-
47
-
48
-
49
-
50
-
51
-
52
-
53
-
54
-
55
-
56
-
57
-
58
-
59
-
60
 |
 |
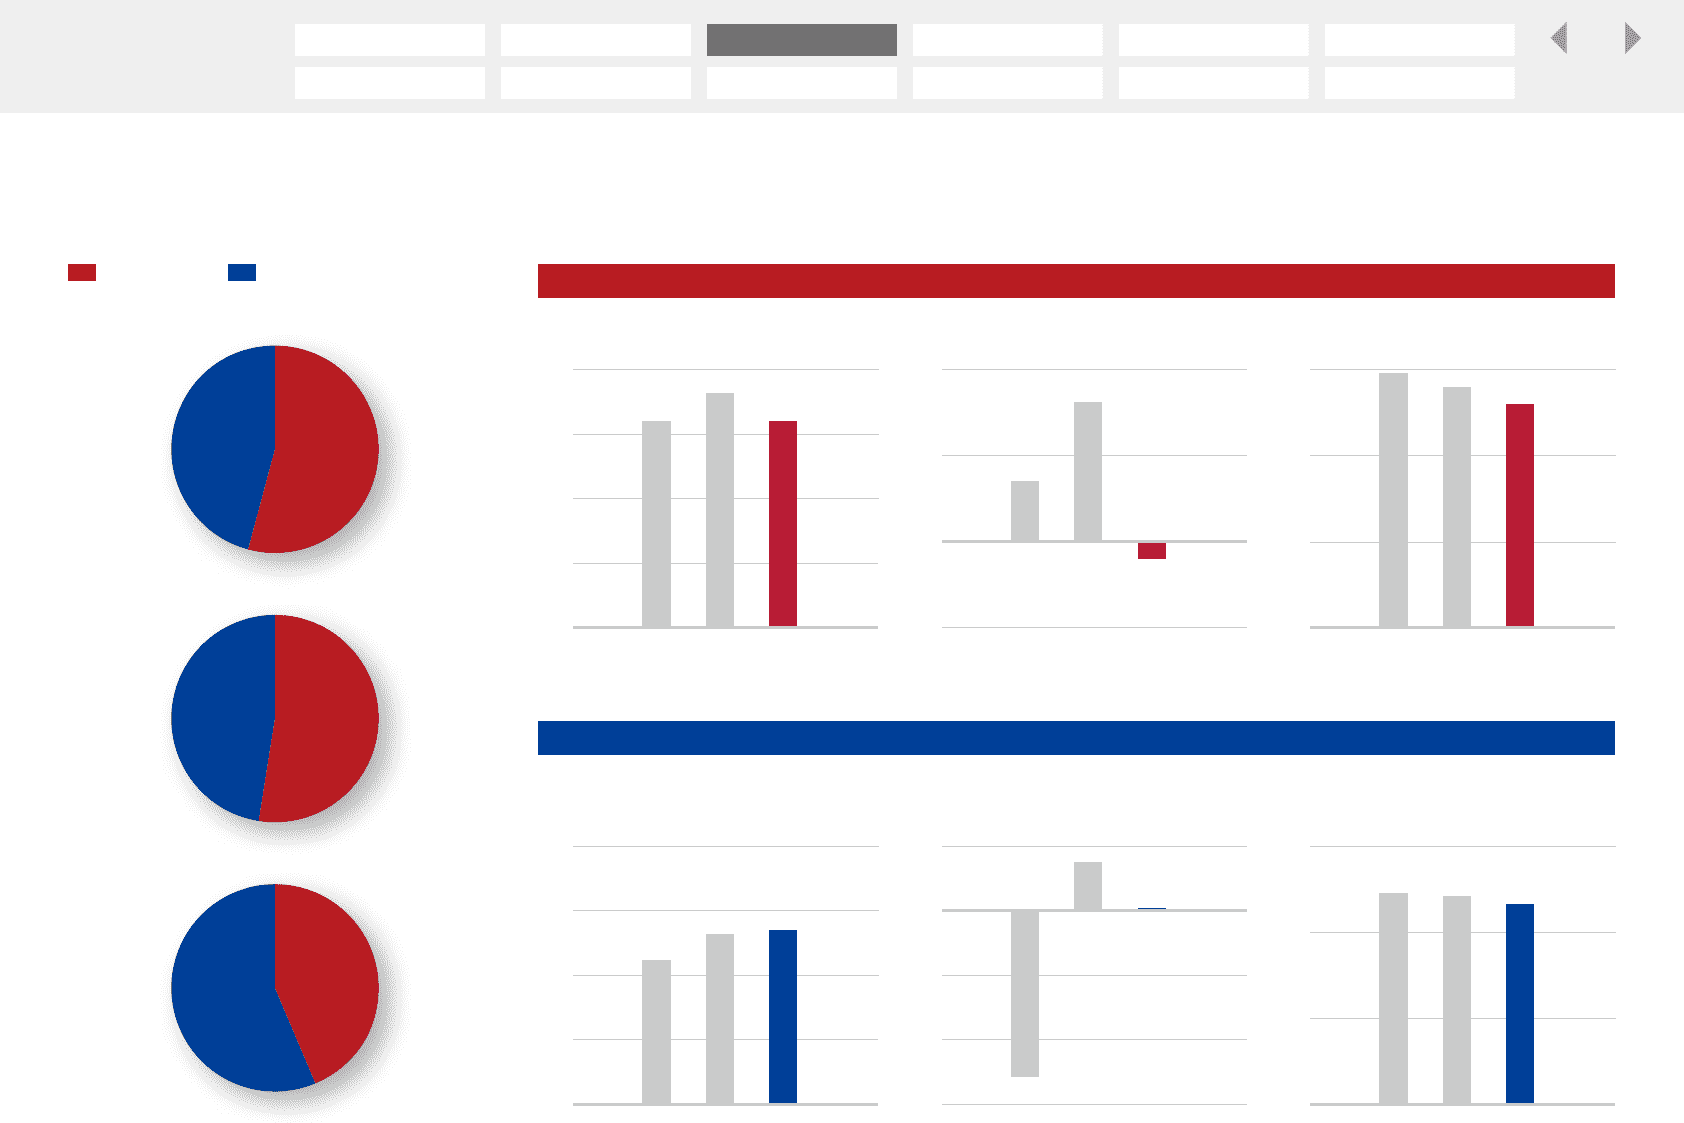
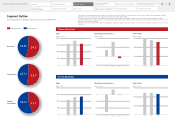
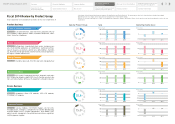
Segment Outline
Sharp Corporation and Consolidated Subsidiaries for the Years Ended March 31
900
600
300
0
120
60
-600
500
(billions of yen)
2,000
1,500
1,000
151413 151413 151413
Sales
(billions of yen)
Operating Income (Loss)
(billions of yen)
Total Assets
0
500
(billions of yen)
2,000
1,500
1,000
151413 151413
Sales Operating Income (Loss)
(billions of yen)
Total Assets
900
600
300
0
60
0
-60
-120
-180
151413
(billions of yen)
0
Product Business
Device Business
・ Sales figures include internal sales between segments (Product Business and Device Business). The percentage of sales in the pie chart has been calculated accordingly.
・ Operating income (loss) figures are the amounts before adjustments for intersegment trading.
・ Total assets figures are the amounts before adjustments for intersegment trading. The percentage of total assets in the pie chart has been calculated accordingly.
・ Capital investment figures include the amounts of leased properties, and do not include unallocated capital investments. The percentage of capital investment in the pie
chart has been calculated accordingly.
・ Effective for the year ended March 31, 2014, the Company has changed its segment classification. Figures for the previous year have been adjusted to reflect the new
classification.
Product Business Device Business
Net Sales
Total Assets
Capital
Investment
54.2%
45.8%
52.7%
47.3%
43.7%
56.3%
2
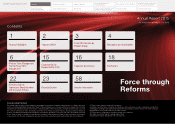
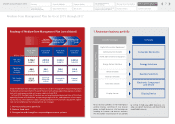
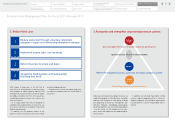
Medium-Term Management Plan
for Fiscal 2015 through 2017
Financial Section
Investor Information
Directors, Audit & Supervisory Board
Members and Executive Officers
Risk Factors
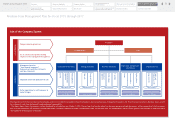
Corporate Governance
Contents
Corporate Social
Responsibility (CSR)
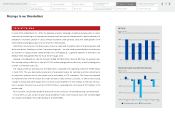
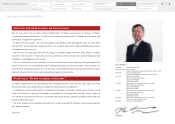
Message to our Shareholders
Fiscal 2014 Review by
Product Group
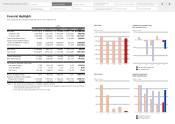
Financial Highlights
SHARP Annual Report 2015
Segment Outline