Sharp 2015 Annual Report Download - page 27
Download and view the complete annual report
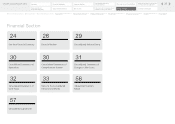
Please find page 27 of the 2015 Sharp annual report below. You can navigate through the pages in the report by either clicking on the pages listed below, or by using the keyword search tool below to find specific information within the annual report.-
 1
1 -
2
-
3
-
4
-
5
-
6
-
7
-
8
-
9
-
10
-
11
-
12
-
13
-
14
-
15
-
16
-
 17
17 -
 18
18 -
 19
19 -
 20
20 -
 21
21 -
 22
22 -
 23
23 -
 24
24 -
 25
25 -
 26
26 -
 27
27 -
 28
28 -
 29
29 -
 30
30 -
 31
31 -
 32
32 -
 33
33 -
 34
34 -
 35
35 -
 36
36 -
 37
37 -
38
-
39
-
40
-
41
-
42
-
43
-
44
-
45
-
46
-
47
-
48
-
49
-
50
-
51
-
52
-
53
-
54
-
55
-
56
-
57
-
58
-
59
-
60
 |
 |

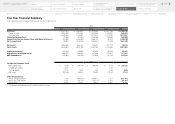
Yen
(millions)
2011 2012 2013 2014 2015
Net Sales ¥ 3,021,973 ¥ 2,455,850 ¥ 2,478,586 ¥ 2,927,186 ¥ 2,786,256
Sales by Product Group*2 (Sales to Outside Customers)
Audio-Visual and Communication Equipment 1,426,243 1,060,770 732,017 — —
Health and Environmental Equipment 269,845 292,224 309,613 — —
Information Equipment 273,900 277,561 296,787 — —
Consumer/Information Products 1,969,988 1,630,555 1,338,417 — —
LCDs 614,373 420,226 650,847 — —
Solar Cells 265,492 223,869 259,895 — —
Other Electronic Devices 172,120 181,200 229,427 — —
Electronic Components 1,051,985 825,295 1,140,169 — —
Total 3,021,973 2,455,850 2,478,586 — —
Digital Information Equipment — — 732,017 733,317 670,326
Health and Environmental Equipment — — 309,613 326,896 315,022
Energy Solutions — — 259,895 439,028 270,881
Business Solutions — — 296,787 318,856 340,323
Product Business — — 1,598,312 1,818,097 1,596,552
LCDs — — 650,847 814,718 772,997
Electronic Devices — — 229,427 294,371 416,707
Device Business — — 880,274 1,109,089 1,189,704
Total — — 2,478,586 2,927,186 2,786,256
Sales by Region
Japan 1,592,909 1,181,168 1,007,264 1,150,091 968,449
The Americas 302,021 288,380 355,288 468,473 320,980
Europe 367,962 282,606 174,381 144,804 142,520
China 516,977 483,298 667,933 925,348 1,140,892
Other 242,104 220,398 273,720 238,470 213,415
Total 3,021,973 2,455,850 2,478,586 2,927,186 2,786,256
*2 Effective for the year ended March 31, 2014, the segment classification has been changed. In this regard, Sales by Product Group for the year ended March 31, 2013, has been restated
based on a new classification.
Effective for the year ended March 31, 2015, the ”Solar Cells” product group was renamed as “Energy Solutions.”
Five-Year Financial Summary
25
Five-Year Financial Summary
Financial Section
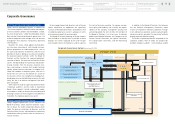
Segment Outline
Medium-Term Management Plan
for Fiscal 2015 through 2017
Investor Information
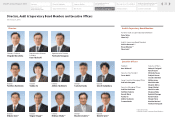
Directors, Audit & Supervisory Board
Members and Executive Officers
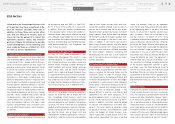
Risk Factors
Corporate Governance
Contents
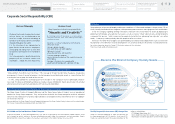
Corporate Social
Responsibility (CSR)
Message to our Shareholders
Fiscal 2014 Review by
Product Group
Financial Highlights
SHARP Annual Report 2015
Consolidated
Subsidiaries
Independent Auditor’s
Report
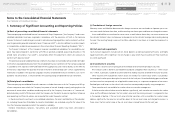
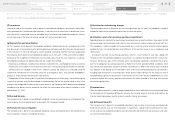
Notes to the Consolidated
Financial Statements
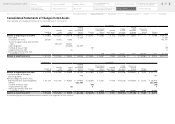
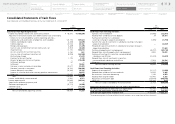
Consolidated Statements of
Cash Flows
Consolidated Statements of
Changes in Net Assets
Consolidated Statements of
Comprehensive Income
Consolidated Statements of
Operations
Consolidated Balance Sheets
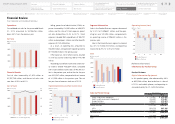
Financial Review