Sharp 2015 Annual Report Download - page 29
Download and view the complete annual report
Please find page 29 of the 2015 Sharp annual report below. You can navigate through the pages in the report by either clicking on the pages listed below, or by using the keyword search tool below to find specific information within the annual report.-
 1
1 -
2
-
3
-
4
-
5
-
6
-
7
-
8
-
9
-
10
-
11
-
12
-
13
-
14
-
15
-
16
-
17
-
18
-
 19
19 -
 20
20 -
 21
21 -
 22
22 -
 23
23 -
 24
24 -
 25
25 -
 26
26 -
 27
27 -
 28
28 -
 29
29 -
 30
30 -
 31
31 -
 32
32 -
 33
33 -
 34
34 -
 35
35 -
 36
36 -
 37
37 -
 38
38 -
 39
39 -
40
-
41
-
42
-
43
-
44
-
45
-
46
-
47
-
48
-
49
-
50
-
51
-
52
-
53
-
54
-
55
-
56
-
57
-
58
-
59
-
60
 |
 |
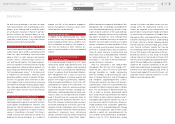
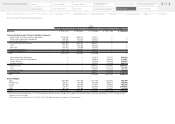
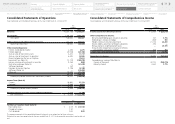
Health and Environmental Equipment
Sales in this group decreased by 3.6% to
¥315,037 million, due to declines in sales of air
conditioners, and operating income declined by
24.2% to ¥15,927 million.
Energy Solutions
Sales in this group declined by 38.3% to
¥270,874 million, due to a decrease in sales of
solar cells. The group posted an operating loss
of ¥62,679 million, compared with operating
income of ¥32,400 million in the previous year.
Business Solutions
Sales in this group climbed by 6.7% to ¥340,332
million, thanks to growth in overseas sales of
MFPs, and operating income increased by 2.8%
to ¥31,403 million.
Device Business
LCDs
Sales in this group decreased by 8.5% to
¥907,105 million, due mainly to a decline in
sales of large-size LCDs. This was despite in-
creased sales of small- and medium-size LCDs
for smartphones and tablets. Operating income
fell by 98.6% to ¥594 million.
Electronic Devices
Sales in this group increased by 35.3% to
¥441,469 million, thanks mainly to increased
sales of camera modules, which contrasted with
lower sales of LEDs. Operating income declined
by 79.3% to ¥676 million.
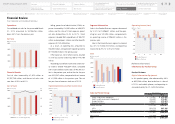
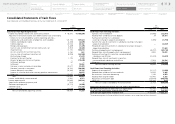
Capital Investment and Depreciation
Capital investment totaled ¥62,653 million, up
26.7% from the previous year. Much of this
investment was allocated to expansion and im-
provement of production lines for small- and
medium-size LCDs, in order to meet flourishing
demand for LCDs for mobile devices such as
smartphones and tablets.
By business segment, capital investment
was ¥26,697 million for the Product Business
and ¥34,340 million for the Device Business.
Unallocated capital investment amounted to
¥1,616 million.
Depreciation and amortization declined by
11.4% to ¥117,323 million.
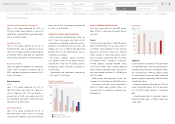
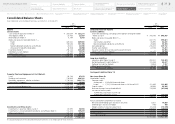
Assets, Liabilities and Net Assets
Total assets amounted to ¥1,961,909 million,
down ¥219,771 million from the end of the pre-
vious year.
Assets
Current assets amounted to ¥1,299,195 million,
down ¥75,049 million. This was due mainly to
a ¥118,423 million decrease in cash and cash
equivalents. By contrast, there was a ¥36,819
million increase in notes and accounts receiv-
able. Inventories increased by ¥43,174 million
to ¥338,300 million. Included in inventories,
finished products increased ¥52,664 million
to ¥213,124 million; work in process declined
¥8,291 million to ¥67,845 million; and raw ma-
terials and supplies were down ¥1,199 million to
¥57,331 million.
Property, plant and equipment, at cost, de-
clined by ¥119,109 million to ¥400,592 million.
Investments and other assets amounted to
¥262,122 million, down ¥25,613 million. This
was due mainly to a decrease in long-term pre-
paid expenses.
Liabilities
Current liabilities increased by ¥135,329 million
to ¥1,686,954 million. Short-term borrowings in-
creased by ¥55,749 million to ¥848,947 million.
This stemmed from a ¥44,362 million increase
in current portion of long-term debt. Notes and
accounts payable increased by ¥58,106 million
to ¥468,019 million.
Long-term liabilities decreased by ¥192,442
million to ¥230,440 million. This was due mainly
to a ¥174,992 million decrease in long-term
debt.
Interest-bearing debt at year-end stood at
¥974,276 million, down ¥119,243 million from
a year earlier.
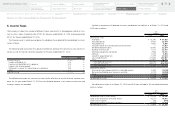
Inventories
(billions of yen)
500
400
300
100
200
0
600
151411 12 13
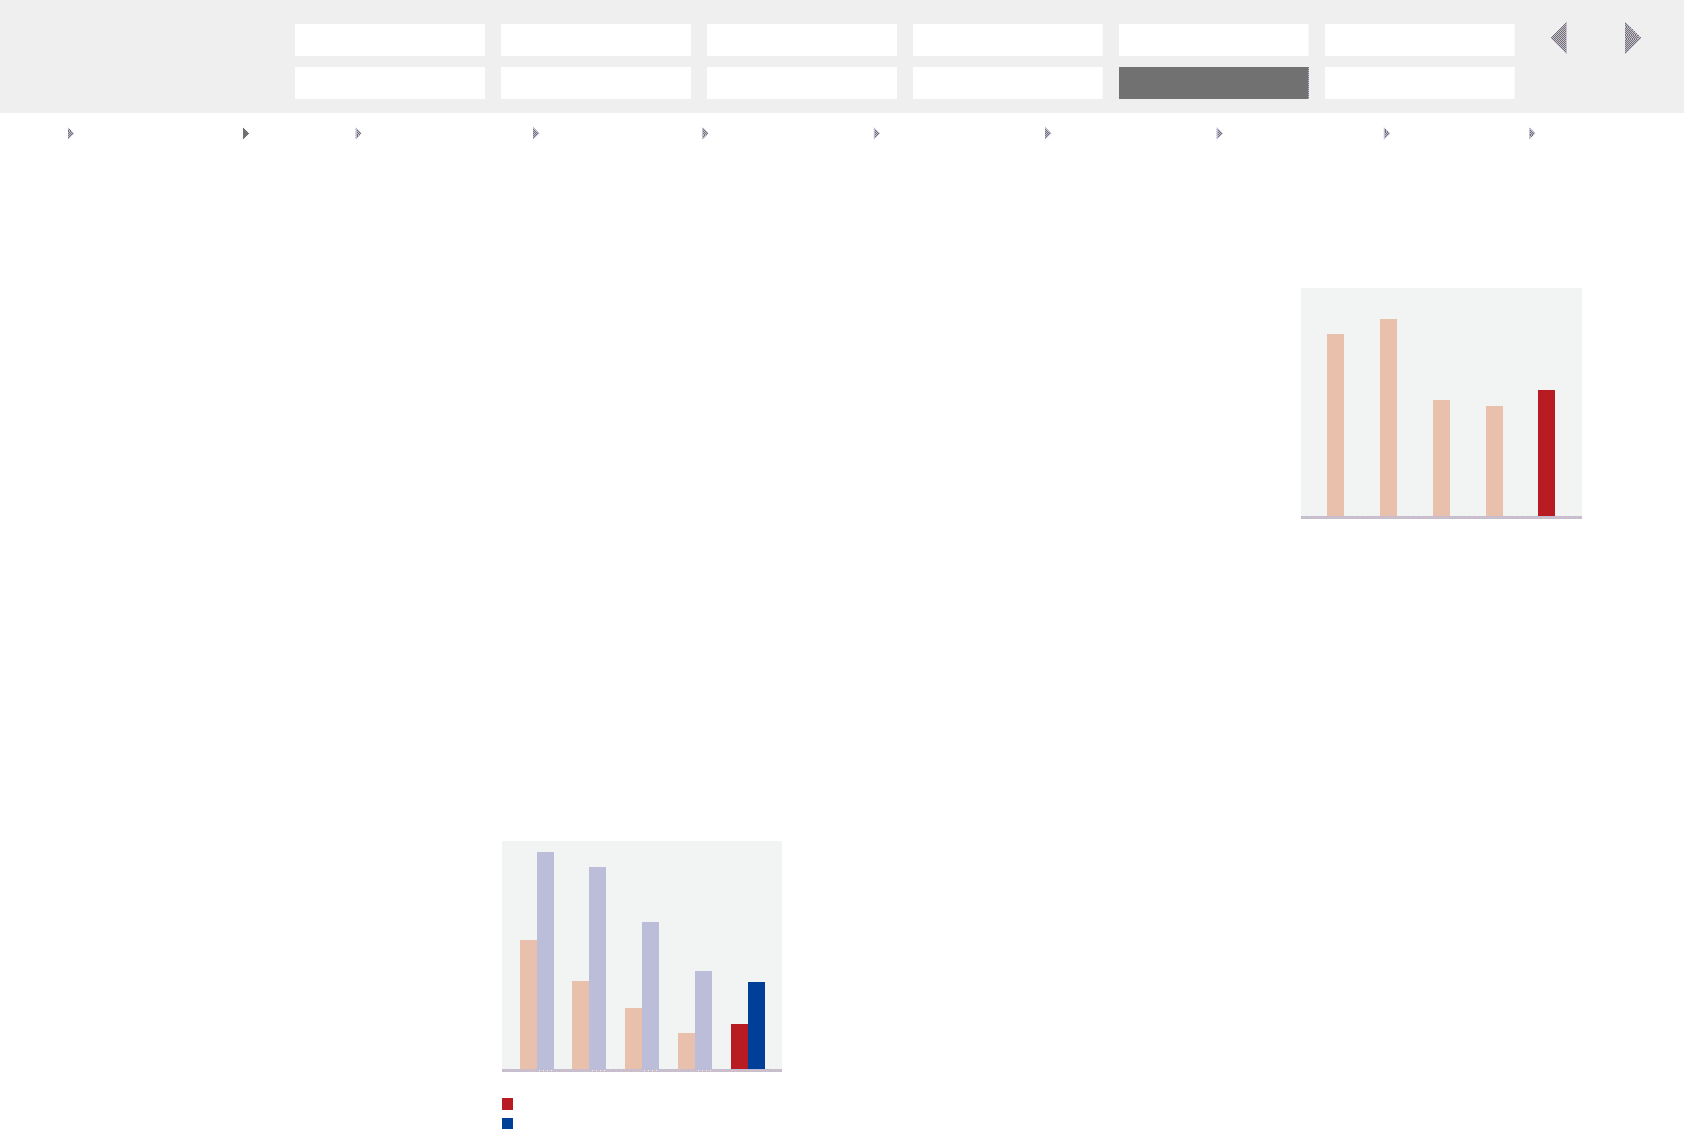
Capital Investment/
Depreciation and Amortization
(billions of yen)
200
100
0
300
151411 12 13
Capital investment
Depreciation and amortization
Financial Review
27
Financial Review
Financial Section
Segment Outline
Medium-Term Management Plan
for Fiscal 2015 through 2017
Investor Information
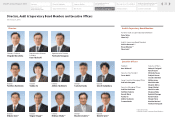
Directors, Audit & Supervisory Board
Members and Executive Officers
Risk Factors
Corporate Governance
Contents
Corporate Social
Responsibility (CSR)
Message to our Shareholders
Fiscal 2014 Review by
Product Group
Financial Highlights
SHARP Annual Report 2015
Consolidated
Subsidiaries
Independent Auditor’s
Report
Notes to the Consolidated
Financial Statements
Consolidated Statements of
Cash Flows
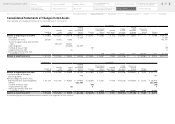
Consolidated Statements of
Changes in Net Assets
Consolidated Statements of
Comprehensive Income
Consolidated Statements of
Operations
Consolidated Balance Sheets
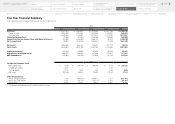
Five-Year Financial Summary