Saab 2013 Annual Report Download - page 3
Download and view the complete annual report
Please find page 3 of the 2013 Saab annual report below. You can navigate through the pages in the report by either clicking on the pages listed below, or by using the keyword search tool below to find specific information within the annual report.-
 1
1 -
 2
2 -
 3
3 -
 4
4 -
 5
5 -
 6
6 -
 7
7 -
 8
8 -
 9
9 -
 10
10 -
 11
11 -
 12
12 -
 13
13 -
 14
14 -
15
-
16
-
17
-
18
-
19
-
20
-
21
-
22
-
23
-
24
-
25
-
26
-
27
-
28
-
29
-
30
-
31
-
32
-
33
-
34
-
35
-
36
-
37
-
38
-
39
-
40
-
41
-
42
-
43
-
44
-
45
-
46
-
47
-
48
-
49
-
50
-
51
-
52
-
53
-
54
-
55
-
56
-
57
-
58
-
59
-
60
-
61
-
62
-
63
-
64
-
65
-
66
-
67
-
68
-
69
-
70
-
71
-
72
-
73
-
74
-
75
-
76
-
77
-
78
-
79
-
80
-
81
-
82
-
83
-
84
-
85
-
86
-
87
-
88
-
89
-
90
-
91
-
92
-
93
-
94
-
95
-
96
-
97
-
98
-
99
-
100
-
101
-
102
-
103
-
104
-
105
-
106
-
107
-
108
-
109
-
110
-
111
-
112
-
113
-
114
-
115
-
116
-
117
-
118
-
119
-
120
-
121
-
122
-
123
-
124
-
125
-
126
-
127
-
128
-
129
-
130
-
131
-
132
-
133
-
134
-
135
-
136
-
137
-
138
-
139
-
140
-
141
-
142
 |
 |

Or
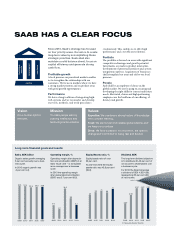
5per cent annually over a busi-
ness cycle.
In 2013 or
-2 per cent (-2).
Operating margin after deprecia-
tion and amortisation (EBIT) of at
least 10 per cent – is formulated
as an average over a business
cycle.
In 2013 the operating margin
after depreciation/amortisation
(EBIT) was 5.7 per cent (8.5).
Equity/assets ratio of over
30 per cent.
At year-end 2013 the equity/
assets ratio was 43.8 per cent
(39.0).
The long-term dividend objective
is to distribute 20–40 per cent of
net income to shareholders over
a business cycle.
For 2013 the Board proposes
a dividend of SEK 4.50 (4.50),
representing 65 per cent (30)
of net income.
S
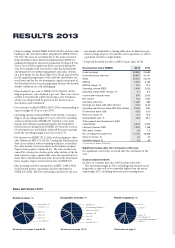
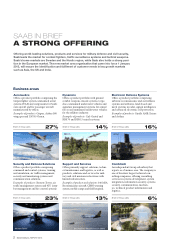
Sales distribution 2013
Business areas, %
Aeronautics, 27
Dynamics, 14
EDS, 16
SDS, 23
S&S, 13
Combitech, 6
Read more on pages 2 and 45-50
Geographic markets, %
Sweden, 41
EU excluding Sweden, 17
Rest of Europe, 3
Americas, 13
Asia, 18
Africa, 4
Australia, etc., 5
Read more on page 12–13
Market segments, %
Air, 45
Land, 27
Naval, 10
Civil Security, 8
Commercial Aeronautics, 7
Other, 3
Read more on page 3
also to several other signifi cant orders received during the
and integration of combat management and radar systems
on a new frigate for the Royal ai Navy. Brazil placed orders
for the upgrade programme of the airborne surveillance sys-
the Brazilian border security programme Sisfron. Meanwhile,
market conditions are still challenging.
activity level primarily within the business area Dynamics,
which was compensated by growth in the business areas
Aeronautics and Combitech.
of a potential earn-out liability. Adjusted for non-recurring
Saab, in accordance with accounting standards, reclassifi ed
the value decline of the investment in the Indian company
Pipavav from equity to fi nancial net. e value decline was
caused by a share price decline and a value decline of the In-
done. e reclassifi cation and write-down of the investment
RESULTS 2013
was mainly attributable to timing diff erences in milestone pay-
ments in large projects, investments and acquisitions, as well as
a payment related to a legal dispute.
Key fi nancial ratios (MSEK) 2013 2012
Order bookings 49,809 20,683
Order backlog at year-end 59,870 34,151
Sales 23,750 24,010
EBITDA 2,367 3,186
EBITDA margin, % 10.0 13.3
Operating income (EBIT) 1,345 2,050
Operating margin (EBIT margin), % 5.7 8.5
Income after fi nancial items 979 2,003
Net income 742 1,560
Operating cash fl ow -1,480 -396
Earnings per share, SEK (after dilution) 6.79 14.52
Operating cash fl ow per share, SEK (after dilution) -13.56 -3.63
Dividend per share, SEK 4.5014.50
Return on equity, % 6.3 12.8
Equity/Assets ratio, % 43.8 39.0
Total research and development (R&D)
expenditures 6,543 5,946
Internally fi nanced R&D 1,332 1,798
R&D share of sales 5.6 7.5
No. of employees at year-end 14,140 13,968
Share of women, % 22 22
Academic degree, % 57 55
1) Proposed by Board of Directors
Signifi cant events after the conclusion of the year:
No signifi cant events have occurred a er the conclusion of the
year.
Outlook statement 2014:
ring items, is expected to be somewhat higher than the opera-