Redbox 2012 Annual Report Download - page 84
Download and view the complete annual report
Please find page 84 of the 2012 Redbox annual report below. You can navigate through the pages in the report by either clicking on the pages listed below, or by using the keyword search tool below to find specific information within the annual report.-
 1
1 -
2
-
3
-
4
-
5
-
6
-
7
-
8
-
9
-
10
-
11
-
12
-
13
-
14
-
15
-
16
-
17
-
18
-
19
-
20
-
21
-
22
-
23
-
24
-
25
-
26
-
27
-
28
-
29
-
30
-
31
-
32
-
33
-
34
-
35
-
36
-
37
-
38
-
39
-
40
-
41
-
42
-
43
-
44
-
45
-
46
-
47
-
48
-
49
-
50
-
51
-
52
-
53
-
54
-
55
-
56
-
57
-
58
-
59
-
60
-
61
-
62
-
63
-
64
-
65
-
66
-
67
-
68
-
69
-
70
-
71
-
72
-
73
-
 74
74 -
 75
75 -
 76
76 -
 77
77 -
 78
78 -
 79
79 -
 80
80 -
 81
81 -
 82
82 -
 83
83 -
 84
84 -
 85
85 -
 86
86 -
 87
87 -
 88
88 -
 89
89 -
 90
90 -
 91
91 -
 92
92 -
 93
93 -
 94
94 -
95
-
96
-
97
-
98
-
99
-
100
-
101
-
102
-
103
-
104
-
105
 |
 |

directors and employees (“segment operating income”). Segment operating income contains internally allocated
costs of our shared service support functions, including corporate executive management, business development,
sales, finance, legal, human resources, information technology, and risk management. We also review
depreciation and amortization allocated to each segment. Shared-based payments expense related to share-based
compensation granted to executives, non-employee directors and employees is not allocated to our segments and
is included in the corporate unallocated column in the analysis and reconciliation below; however, share-based
payments expense related to our content arrangements with certain movie studios has been allocated to our
Redbox segment and is included within direct operating expenses. Our performance evaluation does not include
segment assets.
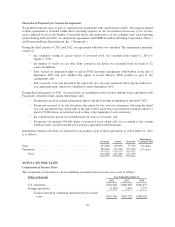
During the second quarter of 2012, we completed the NCR Asset Acquisition. The assets acquired and liabilities
assumed, as well as the results of operations, are included in our Redbox segment. See Note 3: Business
Combination for additional information about the acquisition.
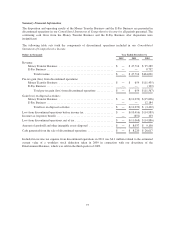
Our analysis and reconciliation of our segment information to the consolidated financial statements that follows
covers our results from continuing operations, which consists of our Redbox, Coin and New Ventures segments.
Unallocated general and administrative expenses relate to share-based compensation.
In thousands
Year Ended December 31, 2012 Redbox Coin
New
Ventures
Corporate
Unallocated Total
Revenue ................................. $1,908,773 $290,761 $ 2,509 $ — $2,202,043
Expenses:
Direct operating ....................... 1,340,899 155,740 5,475 863 1,502,977
Marketing ............................ 20,497 4,938 2,134 66 27,635
Research and development .............. 739 4,455 8,385 334 13,913
General and administrative .............. 159,885 26,367 11,999 11,984 210,235
Segment operating income (loss) ............. 386,753 99,261 (25,484) (13,247) 447,283
Less: depreciation and amortization ....... (148,068) (36,108) (349) — (184,525)
Operating income (loss) .................... 238,685 63,153 (25,833) (13,247) 262,758
Loss from equity method investments, net . . — — — (5,184) (5,184)
Interest expense, net ................... — — — (15,648) (15,648)
Other, net ............................ — — — (180) (180)
Income (loss) from continuing operations before
income taxes ........................... $ 238,685 $ 63,153 $(25,833) $(34,259) $ 241,746
In thousands
Year Ended December 31, 2011 Redbox Coin
New
Ventures
Corporate
Unallocated Total
Revenue ................................. $1,561,598 $282,382 $ 1,392 $ — $1,845,372
Expenses:
Direct operating ....................... 1,134,167 145,362 3,349 473 1,283,351
Marketing ............................ 22,041 6,142 771 50 29,004
Research and development .............. 74 6,542 4,623 318 11,557
General and administrative .............. 120,384 23,370 10,464 9,139 163,357
Segment operating income (loss) ............. 284,932 100,966 (17,815) (9,980) 358,103
Less: depreciation and amortization ....... (115,430) (31,922) (866) — (148,218)
Operating income (loss) .................... 169,502 69,044 (18,681) (9,980) 209,885
Loss from equity method investments, net . . — — — (1,591) (1,591)
Interest expense, net ................... — — — (23,822) (23,822)
Other, net ............................ — — — 256 256
Income (loss) from continuing operations before
income taxes ........................... $ 169,502 $ 69,044 $(18,681) $(35,137) $ 184,728
77