Redbox 2012 Annual Report Download - page 43
Download and view the complete annual report
Please find page 43 of the 2012 Redbox annual report below. You can navigate through the pages in the report by either clicking on the pages listed below, or by using the keyword search tool below to find specific information within the annual report.-
 1
1 -
2
-
3
-
4
-
5
-
6
-
7
-
8
-
9
-
10
-
11
-
12
-
13
-
14
-
15
-
16
-
17
-
18
-
19
-
20
-
21
-
22
-
23
-
24
-
25
-
26
-
27
-
28
-
29
-
30
-
31
-
32
-
 33
33 -
 34
34 -
 35
35 -
 36
36 -
 37
37 -
 38
38 -
 39
39 -
 40
40 -
 41
41 -
 42
42 -
 43
43 -
 44
44 -
 45
45 -
 46
46 -
 47
47 -
 48
48 -
 49
49 -
 50
50 -
 51
51 -
 52
52 -
 53
53 -
54
-
55
-
56
-
57
-
58
-
59
-
60
-
61
-
62
-
63
-
64
-
65
-
66
-
67
-
68
-
69
-
70
-
71
-
72
-
73
-
74
-
75
-
76
-
77
-
78
-
79
-
80
-
81
-
82
-
83
-
84
-
85
-
86
-
87
-
88
-
89
-
90
-
91
-
92
-
93
-
94
-
95
-
96
-
97
-
98
-
99
-
100
-
101
-
102
-
103
-
104
-
105
 |
 |

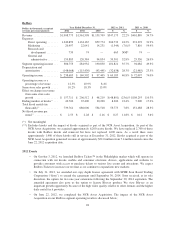
A reconciliation of core adjusted EBITDA from continuing operations to income from continuing operations, the
most comparable GAAP financial measure, is presented in the following table:
Dollars in thousands Year Ended December 31, 2012 vs. 2011 2011 vs. 2010
2012 2011 2010 $ % $ %
Income from continuing
operations .................... $150,230 $114,951 $ 65,894 $ 35,279 30.7% $ 49,057 74.4%
Depreciation, amortization and
other .................... 184,525 148,218 126,992 36,307 24.5% 21,226 16.7%
Interest expense, net .......... 15,648 23,822 34,705 (8,174) (34.3)% (10,883) (31.4)%
Income taxes ................ 91,516 69,777 43,032 21,739 31.2% 26,745 62.2%
Share-based payments
expense(1) ................ 19,362 16,211 16,016 3,151 19.4% 195 1.2%
Adjusted EBITDA from
continuing operations . . . 461,281 372,979 286,639 88,302 23.7% 86,340 30.1%
Non-core adjustments:
Deal fees ................... 3,235 1,603 — 1,632 101.8% 1,603 —
Loss from equity method
investments ............... 24,684 1,591 — 23,093 1,451% 1,591 —
Gain on formation of Redbox
Instant by Verizon ......... (19,500) — — (19,500) — — —
Core adjusted EBITDA
from continuing
operations ............ $469,700 $376,173 $286,639 $ 93,527 24.9% $ 89,534 31.2%
(1) Includes non-cash share-based compensation for executives, non-employee directors and employees as well
as share-based payments for content arrangements.
The increases in our core adjusted EBITDA during both 2012 and 2011 were primarily due to improvements in
the results of our Redbox segment. The other components of core adjusted EBITDA have been discussed
previously in the Results of Operations section above.
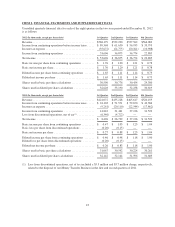
Core Diluted EPS from Continuing Operations
Our non-GAAP financial measure core diluted EPS from continuing operations is defined as diluted earnings per
share from continuing operations excluding Non-Core Adjustments, net of applicable taxes.
A reconciliation of core diluted EPS from continuing operations to diluted EPS from continuing operations, the
most comparable GAAP financial measure, is presented in the following table:
Dollars in thousands Year Ended December 31, 2012 vs. 2011 2011 vs. 2010
2012 2011 2010 $ % $ %
Diluted EPS from continuing operations ........ $4.67 $3.61 $2.03 1.06 29.4% 1.58 77.8%
Non-core adjustments, net of tax:(1)
Deal fees ............................. 0.06 0.03 — 0.03 100.0% 0.03
Loss from equity method investments ...... 0.47 0.03 — 0.44 0.03
Gain on formation of Redbox Instant by
Verizon ............................ (0.37) — — (0.37) —
Core diluted EPS from continuing operations .... $4.83 $3.67 $2.03 1.16 31.6% 1.64 80.8%
(1) Non-Core Adjustments are presented after-tax using the applicable effective tax rate for the respective
periods.
36