Redbox 2012 Annual Report Download - page 33
Download and view the complete annual report
Please find page 33 of the 2012 Redbox annual report below. You can navigate through the pages in the report by either clicking on the pages listed below, or by using the keyword search tool below to find specific information within the annual report.-
 1
1 -
2
-
3
-
4
-
5
-
6
-
7
-
8
-
9
-
10
-
11
-
12
-
13
-
14
-
15
-
16
-
17
-
18
-
19
-
20
-
21
-
22
-
 23
23 -
 24
24 -
 25
25 -
 26
26 -
 27
27 -
 28
28 -
 29
29 -
 30
30 -
 31
31 -
 32
32 -
 33
33 -
 34
34 -
 35
35 -
 36
36 -
 37
37 -
 38
38 -
 39
39 -
 40
40 -
 41
41 -
 42
42 -
 43
43 -
44
-
45
-
46
-
47
-
48
-
49
-
50
-
51
-
52
-
53
-
54
-
55
-
56
-
57
-
58
-
59
-
60
-
61
-
62
-
63
-
64
-
65
-
66
-
67
-
68
-
69
-
70
-
71
-
72
-
73
-
74
-
75
-
76
-
77
-
78
-
79
-
80
-
81
-
82
-
83
-
84
-
85
-
86
-
87
-
88
-
89
-
90
-
91
-
92
-
93
-
94
-
95
-
96
-
97
-
98
-
99
-
100
-
101
-
102
-
103
-
104
-
105
 |
 |

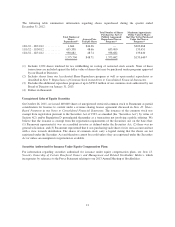
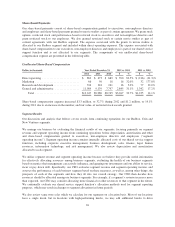
Share-Based Payments
Our share-based payments consist of share-based compensation granted to executives, non-employee directors
and employees and share-based payments granted to movie studios as part of content agreements. We grant stock
options, restricted stock and performance-based restricted stock to executives and non-employee directors and
grant restricted stock to our employees. We also granted restricted stock to certain movie studios as part of
content agreements with our Redbox segment. The expense associated with the grants to movie studios is
allocated to our Redbox segment and included within direct operating expenses. The expense associated with
share-based compensation to our executives, non-employee directors and employees is part of our shared service
support function and is not allocated to our segments. The components of our unallocated share-based
compensation expense are presented in the following table.
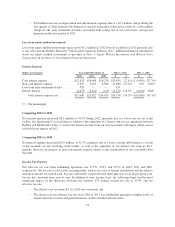
Unallocated Share-Based Compensation
Dollars in thousands Year Ended December 31, 2012 vs. 2011 2011 vs. 2010
2012 2011 2010 $ % $ %
Direct operating .......................... $ 863 $ 473 $ 689 $ 390 82.5% $ (216) (31.3)%
Marketing ............................... 66 50 18 16 32.0% 32 177.8%
Research and development .................. 334 318 241 16 5.0% 77 32.0%
General and administrative ................. 11,984 9,139 7,797 2,845 31.1% 1,342 17.2%
Total ............................... $13,247 $9,980 $8,745 $3,267 32.7% $1,235 14.1%
Share-based compensation expense increased $3.3 million, or 32.7% during 2012 and $1.2 million, or 14.1%
during 2011 due to an increase in the number, and fair value, of restricted stock awards granted.
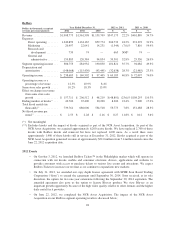
Segment Results
Our discussion and analysis that follows covers results from continuing operations for our Redbox, Coin and
New Ventures segments.
We manage our business by evaluating the financial results of our segments, focusing primarily on segment
revenue and segment operating income from continuing operations before depreciation, amortization and other
and share-based compensation granted to executives, non-employee directors and employees (“segment
operating income”). Segment operating income contains internally allocated costs of our shared service support
functions, including corporate executive management, business development, sales, finance, legal, human
resources, information technology, and risk management. We also review depreciation and amortization
allocated to each segment.
We utilize segment revenue and segment operating income because we believe they provide useful information
for effectively allocating resources among business segments, evaluating the health of our business segments
based on metrics that management can actively influence, and gauging our investments and our ability to service,
incur or pay down debt. Specifically, our CEO evaluates segment revenue and segment operating income, and
assesses the performance of each business segment based on these measures, as well as, among other things, the
prospects of each of the segments and how they fit into our overall strategy. Our CEO then decides how
resources should be allocated among our business segments. For example, if a segment’s revenue increases more
than expected, our CEO may consider allocating more financial or other resources to that segment in the future.
We continually evaluate our shared service support function’s allocation methods used for segment reporting
purposes, which may result in changes to segment allocations in future periods.
We also review same store sales which we calculate for our segments on a location basis. Most of our locations
have a single kiosk, but in locations with high-performing kiosks, we may add additional kiosks to drive
26