Pfizer 2013 Annual Report Download - page 104
Download and view the complete annual report
Please find page 104 of the 2013 Pfizer annual report below. You can navigate through the pages in the report by either clicking on the pages listed below, or by using the keyword search tool below to find specific information within the annual report.-
 1
1 -
2
-
3
-
4
-
5
-
6
-
7
-
8
-
9
-
10
-
11
-
12
-
13
-
14
-
15
-
16
-
17
-
18
-
19
-
20
-
21
-
22
-
23
-
24
-
25
-
26
-
27
-
28
-
29
-
30
-
31
-
32
-
33
-
34
-
35
-
36
-
37
-
38
-
39
-
40
-
41
-
42
-
43
-
44
-
45
-
46
-
47
-
48
-
49
-
50
-
51
-
52
-
53
-
54
-
55
-
56
-
57
-
58
-
59
-
60
-
61
-
62
-
63
-
64
-
65
-
66
-
67
-
68
-
69
-
70
-
71
-
72
-
73
-
74
-
75
-
76
-
77
-
78
-
79
-
80
-
81
-
82
-
83
-
84
-
85
-
86
-
87
-
88
-
89
-
90
-
91
-
92
-
93
-
 94
94 -
 95
95 -
 96
96 -
 97
97 -
 98
98 -
 99
99 -
 100
100 -
 101
101 -
 102
102 -
 103
103 -
 104
104 -
 105
105 -
 106
106 -
 107
107 -
 108
108 -
 109
109 -
 110
110 -
 111
111 -
 112
112 -
 113
113 -
 114
114 -
115
-
116
-
117
-
118
-
119
-
120
-
121
-
122
-
123
 |
 |

Notes to Consolidated Financial Statements
Pfizer Inc. and Subsidiary Companies
2013 Financial Report
103
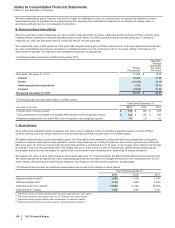
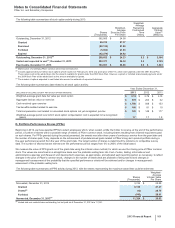
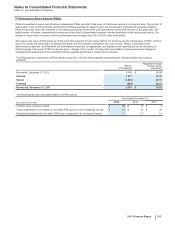
F. Performance Share Awards (PSAs)
PSAs are awarded to senior and other key management. PSAs vest after three years of continuous service from the grant date. The number of
shares paid, if any, including shares resulting from dividend equivalents, depends upon the achievement of predetermined goals related to
Pfizer's total share return as compared to an industry peer group, for the three-year performance period from the year of the grant date. The
target number of shares is determined by reference to the value of share-based awards to similar employees in the industry peer group. The
number of shares that are earned over the performance period ranges from 0% to 200% of the initial award.
We measure the value of PSA grants as of the grant date using the intrinsic value method, for which we use the closing price of Pfizer common
stock. The values are amortized on a straight-line basis over the probable vesting term into Cost of sales, Selling, informational and
administrative expenses, and Research and development expenses, as appropriate, and adjusted each reporting period, as necessary, to
reflect changes in the price of Pfizer's common stock, changes in the number of shares that are probable of being earned and changes in
management's assessment of the probability that the specified performance criteria will be achieved.
The following table summarizes all PSA activity during 2013, with the shares granted representing the maximum award that could be
achieved:
Shares
(Thousands)
Weighted-Average
Intrinsic Value
Per Share
Nonvested, December 31, 2012 5,749 $25.08
Granted 1,377 27.37
Vested (1,463)27.37
Forfeited (624)28.21
Nonvested, December 31, 2013 5,039 $30.63
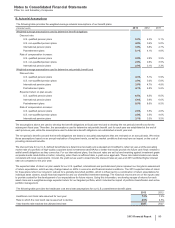
The following table provides data related to all PSA activity:
Year Ended December 31,
(MILLIONS OF DOLLARS) 2013 2012 2011
Total fair value of shares vested $ 40 $ 13 $ 4
Total compensation cost related to nonvested PSA grants not yet recognized, pre-tax $ 25 $ 27 $ 25
Weighted-average period over which PSA cost is expected to be recognized (years) 1.7 1.7 1.9