Pfizer 2008 Annual Report Download - page 66
Download and view the complete annual report
Please find page 66 of the 2008 Pfizer annual report below. You can navigate through the pages in the report by either clicking on the pages listed below, or by using the keyword search tool below to find specific information within the annual report.-
 1
1 -
2
-
3
-
4
-
5
-
6
-
7
-
8
-
9
-
10
-
11
-
12
-
13
-
14
-
15
-
16
-
17
-
18
-
19
-
20
-
21
-
22
-
23
-
24
-
25
-
26
-
27
-
28
-
29
-
30
-
31
-
32
-
33
-
34
-
35
-
36
-
37
-
38
-
39
-
40
-
41
-
42
-
43
-
44
-
45
-
46
-
47
-
48
-
49
-
50
-
51
-
52
-
53
-
54
-
55
-
 56
56 -
 57
57 -
 58
58 -
 59
59 -
 60
60 -
 61
61 -
 62
62 -
 63
63 -
 64
64 -
 65
65 -
 66
66 -
 67
67 -
 68
68 -
 69
69 -
 70
70 -
 71
71 -
 72
72 -
 73
73 -
 74
74 -
 75
75 -
 76
76 -
77
-
78
-
79
-
80
-
81
-
82
-
83
-
84
-
85
-
86
-
87
-
88
-
89
-
90
-
91
-
92
-
93
-
94
-
95
-
96
-
97
-
98
-
99
-
100
 |
 |

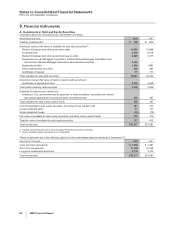
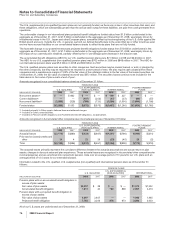
Notes to Consolidated Financial Statements
Pfizer Inc and Subsidiary Companies
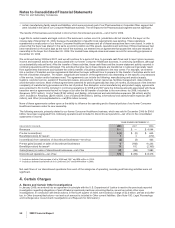
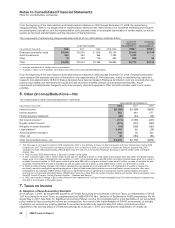
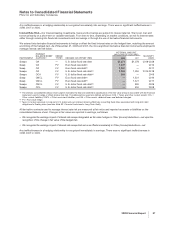
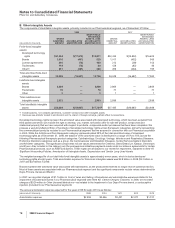
9. Financial Instruments
A. Investments in Debt and Equity Securities
Information about our investments as of December 31 follows:
(MILLIONS OF DOLLARS) 2008 2007
Trading investments(a) $ 190 $ 256
Amortized cost and fair value of available-for-sale debt securities(b):
Western European and other government debt 14,639 10,848
Corporate debt 5,388 6,579
Western European and other government agency debt 5,040 4,277
Federal Home Loan Mortgage Corporation, Federal National Mortgage Association and
Government National Mortgage Association asset-backed securities 2,386 —
Supranational debt 1,956 1,892
Other asset-backed securities 635 490
Certificates of deposit 17 117
Total available-for-sale debt securities 30,061 24,203
Amortized cost and fair value of held-to-maturity debt securities(b):
Certificates of deposit and other 2,349 2,609
Total held-to-maturity debt securities 2,349 2,609
Available-for-sale money market fund:
Investing in U.S. government and its agencies’ or instrumentalities’ securities and reverse
repurchase agreements involving the same investments held 398 297
Total available-for-sale money market funds 398 297
Cost of available-for-sale equity securities, excluding money market funds 341 202
Gross unrealized gains 17 127
Gross unrealized losses (39) (13)
Fair value of available-for-sale equity securities, excluding money market funds 319 316
Total fair value of available-for-sale equity securities 717 613
Total investments $33,317 $27,681
(a) Trading investments are held in trust for legacy Pharmacia severance benefits.
(b) Gross unrealized gains and losses are not significant.
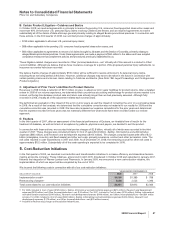
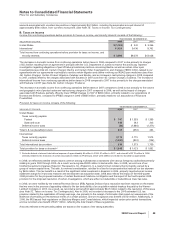
These investments are in the following captions in the consolidated balance sheets as of December 31:
(MILLIONS OF DOLLARS) 2008 2007
Cash and cash equivalents $ 1,980 $ 2,467
Short-term investments 21,609 22,069
Long-term investments and loans 9,728 3,145
Total investments $33,317 $27,681
64 2008 Financial Report