Pfizer 2008 Annual Report Download - page 49
Download and view the complete annual report
Please find page 49 of the 2008 Pfizer annual report below. You can navigate through the pages in the report by either clicking on the pages listed below, or by using the keyword search tool below to find specific information within the annual report.-
 1
1 -
2
-
3
-
4
-
5
-
6
-
7
-
8
-
9
-
10
-
11
-
12
-
13
-
14
-
15
-
16
-
17
-
18
-
19
-
20
-
21
-
22
-
23
-
24
-
25
-
26
-
27
-
28
-
29
-
30
-
31
-
32
-
33
-
34
-
35
-
36
-
37
-
38
-
 39
39 -
 40
40 -
 41
41 -
 42
42 -
 43
43 -
 44
44 -
 45
45 -
 46
46 -
 47
47 -
 48
48 -
 49
49 -
 50
50 -
 51
51 -
 52
52 -
 53
53 -
 54
54 -
 55
55 -
 56
56 -
 57
57 -
 58
58 -
 59
59 -
60
-
61
-
62
-
63
-
64
-
65
-
66
-
67
-
68
-
69
-
70
-
71
-
72
-
73
-
74
-
75
-
76
-
77
-
78
-
79
-
80
-
81
-
82
-
83
-
84
-
85
-
86
-
87
-
88
-
89
-
90
-
91
-
92
-
93
-
94
-
95
-
96
-
97
-
98
-
99
-
100
 |
 |

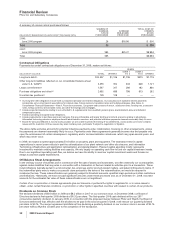
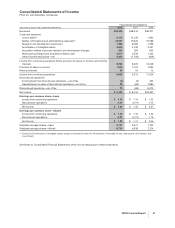
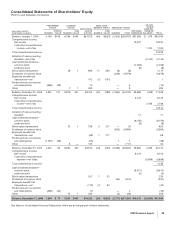
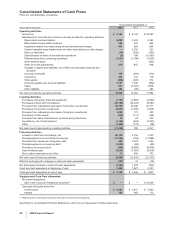
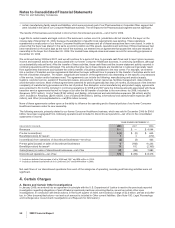
Consolidated Statements of Income
Pfizer Inc and Subsidiary Companies
YEAR ENDED DECEMBER 31,
(MILLIONS, EXCEPT PER COMMON SHARE DATA) 2008 2007 2006
Revenues $48,296 $48,418 $48,371
Costs and expenses:
Cost of sales(a) 8,112 11,239 7,640
Selling, informational and administrative expenses(a) 14,537 15,626 15,589
Research and development expenses(a) 7,945 8,089 7,599
Amortization of intangible assets 2,668 3,128 3,261
Acquisition-related in-process research and development charges 633 283 835
Restructuring charges and acquisition-related costs 2,675 2,534 1,323
Other (income)/deductions—net 2,032 (1,759) (904)
Income from continuing operations before provision for taxes on income, and minority
interests 9,694 9,278 13,028
Provision for taxes on income 1,645 1,023 1,992
Minority interests 23 42 12
Income from continuing operations 8,026 8,213 11,024
Discontinued operations:
Income/(loss) from discontinued operations—net of tax (2) (3) 433
Gains/(losses) on sales of discontinued operations—net of tax 80 (66) 7,880
Discontinued operations—net of tax 78 (69) 8,313
Net income $ 8,104 $ 8,144 $19,337
Earnings per common share—basic
Income from continuing operations $ 1.19 $ 1.19 $ 1.52
Discontinued operations 0.01 (0.01) 1.15
Net income $ 1.20 $ 1.18 $ 2.67
Earnings per common share—diluted
Income from continuing operations $ 1.19 $ 1.18 $ 1.52
Discontinued operations 0.01 (0.01) 1.14
Net income $ 1.20 $ 1.17 $ 2.66
Weighted-average shares—basic 6,727 6,917 7,242
Weighted-average shares—diluted 6,750 6,939 7,274
(a) Exclusive of amortization of intangible assets, except as disclosed in Note 1K.Amortization of Intangible Assets, Depreciation and Certain Long-
Lived Assets.
See Notes to Consolidated Financial Statements, which are an integral part of these statements.
2008 Financial Report 47