Pfizer 2008 Annual Report Download - page 51
Download and view the complete annual report
Please find page 51 of the 2008 Pfizer annual report below. You can navigate through the pages in the report by either clicking on the pages listed below, or by using the keyword search tool below to find specific information within the annual report.-
 1
1 -
2
-
3
-
4
-
5
-
6
-
7
-
8
-
9
-
10
-
11
-
12
-
13
-
14
-
15
-
16
-
17
-
18
-
19
-
20
-
21
-
22
-
23
-
24
-
25
-
26
-
27
-
28
-
29
-
30
-
31
-
32
-
33
-
34
-
35
-
36
-
37
-
38
-
39
-
40
-
 41
41 -
 42
42 -
 43
43 -
 44
44 -
 45
45 -
 46
46 -
 47
47 -
 48
48 -
 49
49 -
 50
50 -
 51
51 -
 52
52 -
 53
53 -
 54
54 -
 55
55 -
 56
56 -
 57
57 -
 58
58 -
 59
59 -
 60
60 -
 61
61 -
62
-
63
-
64
-
65
-
66
-
67
-
68
-
69
-
70
-
71
-
72
-
73
-
74
-
75
-
76
-
77
-
78
-
79
-
80
-
81
-
82
-
83
-
84
-
85
-
86
-
87
-
88
-
89
-
90
-
91
-
92
-
93
-
94
-
95
-
96
-
97
-
98
-
99
-
100
 |
 |

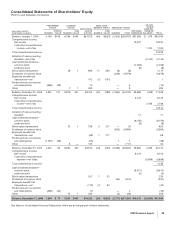
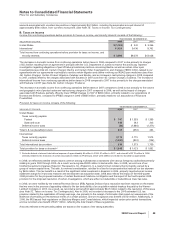
Consolidated Statements of Shareholders’ Equity
Pfizer Inc and Subsidiary Companies
PREFERRED
STOCK
COMMON
STOCK ADDITIONAL
PAID-IN
CAPITAL
EMPLOYEE
BENEFIT TRUST TREASURY STOCK
RETAINED
EARNINGS
ACCUM.
OTHER
COMPRE-
HENSIVE
INC./(EXP.) TOTAL
(MILLIONS, EXCEPT
PREFERRED SHARES) SHARES
STATED
VALUE SHARES
PAR
VALUE SHARES
FAIR
VALUE SHARES COST
Balance, January 1, 2006 4,193 $169 8,784 $439 $67,759 (40) $(923) (1,423) $(39,767) $37,608 $ 479 $65,764
Comprehensive income:
Net income 19,337 19,337
Total other comprehensive
income—net of tax 1,192 1,192
Total comprehensive income 20,529
Adoption of new accounting
standard—net of tax (2,140) (2,140)
Cash dividends declared—
common stock (7,268) (7,268)
preferred stock (8) (8)
Stock option transactions 28 1 896 11 286 (6) (8) 1,175
Purchases of common stock (266) (6,979) (6,979)
Employee benefit trust
transactions—net 152 (1) (151) 1
Preferred stock conversions
and redemptions (696) (28) 12 — 6 (10)
Other 7 1 285 — 8 294
Balance, December 31, 2006 3,497 141 8,819 441 69,104 (30) (788) (1,695) (46,740) 49,669 (469) 71,358
Comprehensive income:
Net income 8,144 8,144
Total other comprehensive
income—net of tax 2,768 2,768
Total comprehensive income 10,912
Adoption of new accounting
standard 11 11
Cash dividends declared—
common stock (8,156) (8,156)
preferred stock (8) (8)
Stock option transactions 23 1 738 5 121 — (7) 853
Purchases of common stock (395) (9,994) (9,994)
Employee benefit trust
transactions—net (49) 1 117 68
Preferred stock conversions
and redemptions (1,195) (48) (25) 1 5 (68)
Other 8 — 145 — (111) 34
Balance, December 31, 2007 2,302 93 8,850 442 69,913 (24) (550) (2,089) (56,847) 49,660 2,299 65,010
Comprehensive income:
Net income 8,104 8,104
Total other comprehensive
expense—net of tax (6,868) (6,868)
Total comprehensive income 1,236
Cash dividends declared—
common stock (8,617) (8,617)
preferred stock (5) (5)
Stock option transactions 207 1 32 239
Purchases of common stock (26) (500) (500)
Employee benefit trust
transactions—net (113) (1) 93 (20)
Preferred stock conversions
and redemptions (498) (20) (7) — 2 (25)
Other 13 1 283 (2) (46) 238
Balance, December 31, 2008 1,804 $ 73 8,863 $443 $70,283 (24) $(425) (2,117) $(57,391) $49,142 $(4,569) $57,556
See Notes to Consolidated Financial Statements, which are an integral part of these statements.
2008 Financial Report 49