Pfizer 2008 Annual Report Download - page 19
Download and view the complete annual report
Please find page 19 of the 2008 Pfizer annual report below. You can navigate through the pages in the report by either clicking on the pages listed below, or by using the keyword search tool below to find specific information within the annual report.-
 1
1 -
2
-
3
-
4
-
5
-
6
-
7
-
8
-
 9
9 -
 10
10 -
 11
11 -
 12
12 -
 13
13 -
 14
14 -
 15
15 -
 16
16 -
 17
17 -
 18
18 -
 19
19 -
 20
20 -
 21
21 -
 22
22 -
 23
23 -
 24
24 -
 25
25 -
 26
26 -
 27
27 -
 28
28 -
 29
29 -
30
-
31
-
32
-
33
-
34
-
35
-
36
-
37
-
38
-
39
-
40
-
41
-
42
-
43
-
44
-
45
-
46
-
47
-
48
-
49
-
50
-
51
-
52
-
53
-
54
-
55
-
56
-
57
-
58
-
59
-
60
-
61
-
62
-
63
-
64
-
65
-
66
-
67
-
68
-
69
-
70
-
71
-
72
-
73
-
74
-
75
-
76
-
77
-
78
-
79
-
80
-
81
-
82
-
83
-
84
-
85
-
86
-
87
-
88
-
89
-
90
-
91
-
92
-
93
-
94
-
95
-
96
-
97
-
98
-
99
-
100
 |
 |

Financial Review
Pfizer Inc and Subsidiary Companies
amount of cash flows approximate the estimated payouts of the plans. For our international plans, the discount rates are set by
benchmarking against investment grade corporate bonds rated AA or better, including where there is sufficient data, a yield curve
approach. Holding all other assumptions constant, the effect of a 0.1 percentage-point decrease in the discount rate assumption is
an increase in our 2009 U.S. qualified pension plans’ pre-tax expense of approximately $12 million and an increase in the U.S.
qualified pension plans’ projected benefit obligations as of December 31, 2008, of approximately $97 million.
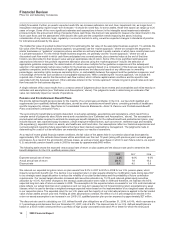
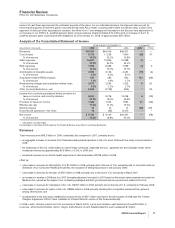
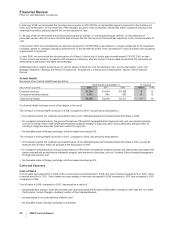
Analysis of the Consolidated Statement of Income
YEAR ENDED DECEMBER 31, % CHANGE
(MILLIONS OF DOLLARS) 2008 2007 2006 08/07 07/06
Revenues $48,296 $48,418 $48,371 ——
Cost of sales 8,112 11,239 7,640 (28) 47
% of revenues 16.8% 23.2% 15.8%
SI&A expenses 14,537 15,626 15,589 (7) —
% of revenues 30.1% 32.3% 32.2%
R&D expenses 7,945 8,089 7,599 (2) 6
% of revenues 16.5% 16.7% 15.7%
Amortization of intangible assets 2,668 3,128 3,261 (15) (4)
% of revenues 5.5% 6.5% 6.7%
Acquisition-related IPR&D charges 633 283 835 123 (66)
% of revenues 1.3% 0.6% 1.7%
Restructuring charges and acquisition-related costs 2,675 2,534 1,323 692
% of revenues 5.5% 5.2% 2.7%
Other (income)/deductions—net 2,032 (1,759) (904) *95
Income from continuing operations before provision for
taxes on income, and minority interests 9,694 9,278 13,028 4(29)
% of revenues 20.1% 19.2% 26.9%
Provision for taxes on income 1,645 1,023 1,992 61 (49)
Effective tax rate 17.0% 11.0% 15.3%
Minority interest 23 42 12 (45) 235
Discontinued operations—net of tax 78 (69) 8,313 **
Net income $ 8,104 $ 8,144 $19,337 —(58)
% of revenues 16.8% 16.8% 40.0%
* Calculation not meaningful.
Percentages in this table and throughout the Financial Review may reflect rounding adjustments.
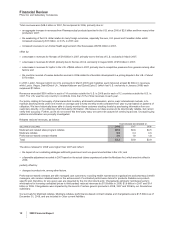
Revenues
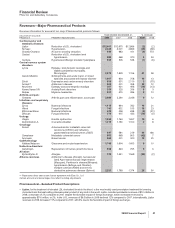
Total revenues were $48.3 billion in 2008, essentially flat compared to 2007, primarily due to:
•an aggregate increase in revenues from Pharmaceutical products launched in the U.S. since 2006 and from many in-line products in
2008;
•the weakening of the U.S. dollar relative to many foreign currencies, especially the euro, Japanese yen and Canadian dollar, which
increased revenues by approximately $1.6 billion, or 3.3%, in 2008; and
•increased revenues in our Animal Health segment and other businesses of $128 million in 2008,
offset by:
•a decrease in revenues for Zytec/Zyrtec D of $1.4 billion in 2008, primarily due to the loss of U.S. exclusivity and, in connection with our
divestiture of our Consumer Healthcare business, the cessation of selling this product in late January 2008;
•a decrease in revenues for Norvasc of $757 million in 2008, primarily due to the loss of U.S. exclusivity in March 2007;
•an increase in rebates in 2008 due to a 2007 favorable adjustment recorded in 2007 based on the actual claims experienced under the
Medicare Act, as well as the impact of our contracting strategies with both government and non-government entities in the U.S.;
•a decrease in revenues for Camptosar in the U.S. of $457 million in 2008, primarily due to the loss of U.S. exclusivity in February 2008;
•a decrease in revenues for Lipitor in the U.S. of $863 million in 2008, primarily resulting from competitive pressures from generics,
among other factors; and
•an adjustment to the prior years’ liabilities for product returns of $217 million recorded in the third quarter of 2008 (see the “Certain
Charges: Adjustment of Prior Years’ Liabilities for Product Returns” section of this Financial Review).
In 2008, Lipitor, Norvasc (which lost U.S. exclusivity in March 2007), Lyrica and Celebrex each delivered at least $2 billion in
revenues, while Geodon/Zeldox, Zyvox, Viagra, Detrol/Detrol LA and Xalatan/Xalacom each surpassed $1 billion.
2008 Financial Report 17