Pentax 2004 Annual Report Download - page 65
Download and view the complete annual report
Please find page 65 of the 2004 Pentax annual report below. You can navigate through the pages in the report by either clicking on the pages listed below, or by using the keyword search tool below to find specific information within the annual report.-
 1
1 -
2
-
3
-
4
-
5
-
6
-
7
-
8
-
9
-
10
-
11
-
12
-
13
-
14
-
15
-
16
-
17
-
18
-
19
-
20
-
21
-
22
-
23
-
24
-
25
-
26
-
27
-
28
-
29
-
30
-
31
-
32
-
33
-
34
-
35
-
36
-
37
-
38
-
39
-
40
-
41
-
42
-
43
-
44
-
45
-
46
-
47
-
48
-
49
-
50
-
51
-
52
-
53
-
54
-
 55
55 -
 56
56 -
 57
57 -
 58
58 -
 59
59 -
 60
60 -
 61
61 -
 62
62 -
 63
63 -
 64
64 -
 65
65 -
 66
66 -
 67
67 -
 68
68 -
 69
69 -
 70
70 -
 71
71 -
 72
72 -
 73
73 -
 74
74
 |
 |

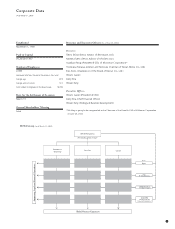
63
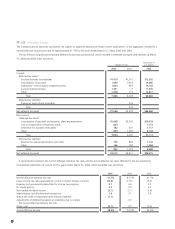
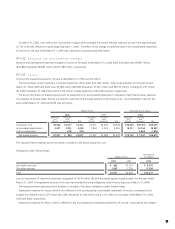
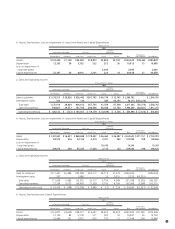
(2) Geographical Segments
The geographical segments of the Company and subsidiaries for the years ended March 31, 2004, 2003 and 2002 are summarized as
follows:
Millions of Yen
2004
Eliminations
Japan North America Europe Asia Total and Corporate Consolidated
Sales to customers ¥188,441 ¥33,113 ¥37,486 ¥12,404 ¥271,444 ¥
271,444
Interarea transfers 16,790 91 849 60,196 77,926 ¥
(77,926)
Total sales 205,231 33,204 38,335 72,600 349,370
(77,926) 271,444
Operating expenses 167,669 31,390 29,294 54,693 283,046
(79,769) 203,277
Operating income ¥037,562 ¥ 1,814,¥ 9,041 ¥17,907 ¥ 66,324 ¥
1,843
¥
68,167
Assets ¥161,336 ¥19,059 ¥26,691 ¥66,338 ¥273,424 ¥
16,463
¥
289,887
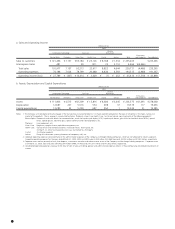
Thousands of U.S. Dollars
2004
Eliminations
Japan North America Europe Asia Total and Corporate Consolidated
Sales to customers $
1,777,745
$312,387 $353,641 $117,019 $
2,560,792
$
2,560,792
Interarea transfers
158,396
858 8,010 567,887
735,151
$(735,151)
Total sales
1,936,141
313,245 361,651 684,906
3,295,943
(735,151)
2,560,792
Operating expenses
1,581,783
296,132 276,358 515,972
2,670,245
(752,538)
1,917,707
Operating income $
354,358
$17,113 $ 85,293 $168,934 $
625,698
$17,387 $
643,085
Assets $
1,522,038
$179,802 $251,802 $625,830 $
2,579,472
$155,311 $
2,734,783
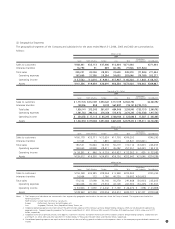
Millions of Yen
2003
Eliminations
Japan North America Europe Asia Total and Corporate Consolidated
Sales to customers ¥166,178 ¥35,771 ¥ 32,639 ¥11,705 ¥246,293 ¥246,293
Interarea transfers 17,343 73 1,891 44,514 63,821 ¥(63,821)
Total sales 183,521 35,844 34,530 56,219 310,114 (63,821) 246,293
Operating expenses 148,960 34,898 28,411 45,282 257,551 (64,241) 193,310
Operating income ¥034,561 ¥00,946 ¥ 6,119 ¥10,937 ¥052,563 ¥ 420 ¥052,983
Assets ¥139,012 ¥19,505 ¥ 34,970 ¥59,156 ¥252,643 ¥21,646 ¥274,289
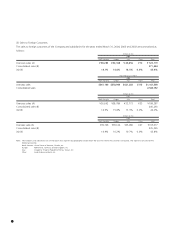
Millions of Yen
2002
Eliminations
Japan North America Europe Asia Total and Corporate Consolidated
Sales to customers ¥159,368 ¥36,985 ¥28,964 ¥09,948 ¥235,265 ¥235,265
Interarea transfers 14,964 113 1,196 40,330 56,603 ¥(56,603)
Total sales 174,332 37,098 30,160 50,278 291,868 (56,603) 235,265
Operating expenses 143,426 35,139 25,918 43,109 247,592 (56,225) 191,367
Operating income ¥030,906 ¥01,959 ¥04,242 ¥07,169 ¥044,276 ¥ (378) ¥043,898
Assets ¥138,963 ¥21,000 ¥30,356 ¥55,412 ¥245,731 ¥ 32,337 ¥278,068
Notes: 1. The Company and subsidiaries are summarized in four segments by geographic area based on the countries where the Group is located. The segments consisted of the
following countries:
North America: United States of America, Canada, etc.
Europe: Netherlands, Germany, United Kingdom, etc.
Asia: Singapore, Thailand, China, Republic of Korea, Taiwan, etc.
2. Corporate operating expenses consist primarily of the administration expenses of the Company and one foreign holding company, which are not allocated to segments by
geographic area. Corporate operating expenses for the years ended March 31, 2004, 2003 and 2002 were ¥2,074 million ($19,566 thousand), ¥1,813 million and ¥1,771
million, respectively.
3. Corporate assets consist primarily of cash, time deposits, investments securities and administrative assets of the Company and one foreign holding company. Corporate assets
as of March 31, 2004, 2003 and 2002 were ¥47,511 million ($448,217 thousand), ¥40,280 million and ¥48,342 million, respectively.
4. Consolidated operating expenses are equal to the total of cost of sales and selling, general and administrative expenses shown in the accompanying consolidated statements of
income.