Pentax 2004 Annual Report Download - page 34
Download and view the complete annual report
Please find page 34 of the 2004 Pentax annual report below. You can navigate through the pages in the report by either clicking on the pages listed below, or by using the keyword search tool below to find specific information within the annual report.-
 1
1 -
2
-
3
-
4
-
5
-
6
-
7
-
8
-
9
-
10
-
11
-
12
-
13
-
14
-
15
-
16
-
17
-
18
-
19
-
20
-
21
-
22
-
23
-
 24
24 -
 25
25 -
 26
26 -
 27
27 -
 28
28 -
 29
29 -
 30
30 -
 31
31 -
 32
32 -
 33
33 -
 34
34 -
 35
35 -
 36
36 -
 37
37 -
 38
38 -
 39
39 -
 40
40 -
 41
41 -
 42
42 -
 43
43 -
 44
44 -
45
-
46
-
47
-
48
-
49
-
50
-
51
-
52
-
53
-
54
-
55
-
56
-
57
-
58
-
59
-
60
-
61
-
62
-
63
-
64
-
65
-
66
-
67
-
68
-
69
-
70
-
71
-
72
-
73
-
74
 |
 |

32
Net Income
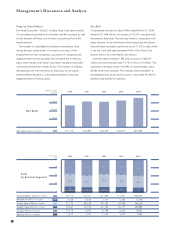
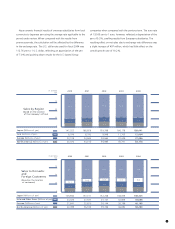
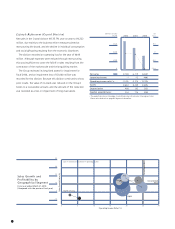
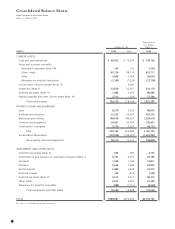
Cost of sales rose 7.1% compared with the previous fiscal year, to
¥142,683 million, reflecting the increase in net sales. However,
this rise of 7.1% was modest compared with the 10.2% increase
in net sales, and the gross profit margin rose to 47.4%, from
45.9% for the previous fiscal year. Selling, general and adminis-
trative expenses rose 0.9% to ¥60,594 million. This increase was
fairly small compared with the rise in net sales, and SG&A
expenses as a percentage of sales fell to 22.3% from 24.4%.
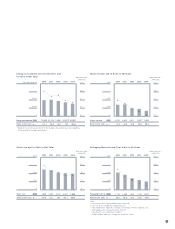
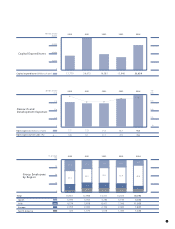
As a result, operating income increased 28.7% year on year to
¥68,167 million, while the operating income ratio rose 3.6
percentage points to 25.1%. By quarter, the operating income
ratio was 22.7% in the first quarter of fiscal 2004, 24.2% in the
second, 25.7% in the third and 27.5% in the fourth.
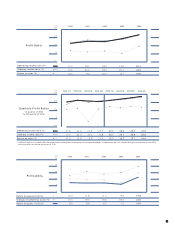
Net income nearly doubled, rising 97.4% year on year to
¥39,549 million. A major factor in this increase was the reduction
in other expenses—net to ¥12,671 million, including amortization
of goodwill, compared with ¥24,240 million in fiscal 2003, which
included additional expenses in connection with the dissolution of
the Group's pension fund.
Net income per share rose ¥179.86 to ¥350.96, compared with
¥171.10 for fiscal 2003. Along with total net sales, this was a new
record high for the Group.
Return on assets (ROA) rose 6.7 percentage points to 14.0%, and
return on equity (ROE) increased 8.8 percentage points to 17.8%.
Cash dividends for the year doubled, from ¥50 per share in the
previous fiscal year to ¥100 per share.
(Millions of yen)
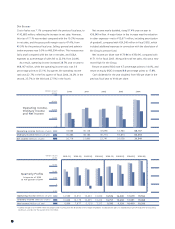
Operating income (Millions of yen)
Ordinary income (Millions of yen)
Net income (Millions of yen)
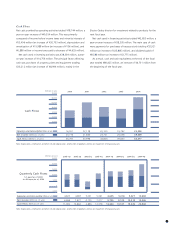
Quarterly Profits
1st quarter of 2003
to 4th quarter of 2004
16,40014,536 17,679 19,552
15,63814,757 17,091 19,068
9,1299,795 10,419 10,206
20,000
15,000
10,000
5,000
0
-5,000
13,95112,599 13,433 13,000
14,17910,848 12,435 13,412
7,9776,869 -2,125*7,317
2004-4Q2004-3Q2004-2Q2004-1Q2003-4Q2003-3Q2003-2Q2003-1Q
*Additional expense of ¥14,949 million for compensation resulting from the dissolution of the Group’s employees’ funded pension plan was recorded during the third quarter of fiscal 2003,
resulting in a net loss for the quarter of ¥2,125 million.
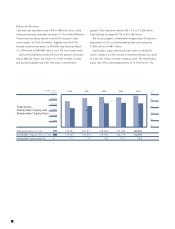
20042000 2001 2002 2003
Operating Income,
Ordinary Income
and Net Income
Operating income (Millions of yen)
Ordinary income (Millions of yen)
Net income (Millions of yen)
80,000
60,000
40,000
20,000
0
68,167
66,554
39,549
34,688 45,128 43,898 52,983
35,484 48,184 45,774 50,874
20,716 21,860 23,741 20,038
(Millions of yen)