Pentax 2004 Annual Report Download - page 49
Download and view the complete annual report
Please find page 49 of the 2004 Pentax annual report below. You can navigate through the pages in the report by either clicking on the pages listed below, or by using the keyword search tool below to find specific information within the annual report.-
 1
1 -
2
-
3
-
4
-
5
-
6
-
7
-
8
-
9
-
10
-
11
-
12
-
13
-
14
-
15
-
16
-
17
-
18
-
19
-
20
-
21
-
22
-
23
-
24
-
25
-
26
-
27
-
28
-
29
-
30
-
31
-
32
-
33
-
34
-
35
-
36
-
37
-
38
-
 39
39 -
 40
40 -
 41
41 -
 42
42 -
 43
43 -
 44
44 -
 45
45 -
 46
46 -
 47
47 -
 48
48 -
 49
49 -
 50
50 -
 51
51 -
 52
52 -
 53
53 -
 54
54 -
 55
55 -
 56
56 -
 57
57 -
 58
58 -
 59
59 -
60
-
61
-
62
-
63
-
64
-
65
-
66
-
67
-
68
-
69
-
70
-
71
-
72
-
73
-
74
 |
 |

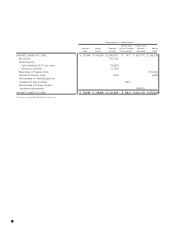
47
Thousands of
U.S. Dollars
Millions of Yen (Note 1)
2004 2003 2002 2004
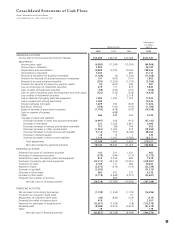
OPERATING ACTIVITIES:
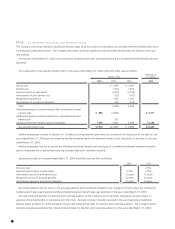
Income before income taxes and minority interests ¥55,496 ¥28,743 ¥37,588 $523,547
Adjustments for:
Income taxes—paid (6,880) (11,509) (15,395) (64,906)
Income taxes—refunded 3,900 36,792
Depreciation and amortization 19,988 19,792 19,636 188,566
Amortization of goodwill 3,300 469 31,132
Reversal of allowance for doubtful receivables (1,169) (6) (1,530) (11,028)
Provision for (reversal of) accrued bonuses to employees 191 (360) (191) 1,802
Reversal of accrued retirement benefits (293) (7,256) (1,193) (2,764)
Provision for (reversal of) reserve for periodic repairs 94 (367) 243 887
Loss on write-down of investment securities 619 111 479 5,840
Gain on sales of investment securities (59) (109) (137) (556)
Gain on sales of property, plant and equipment and other assets
(523) (725) (336) (4,934)
Loss on sales of investment securities 7 3,118
Loss on disposal of property, plant and equipment 1,900 1,947 1,529 17,925
Loss on impairment of long-lived assets 2,040 19,245
Foreign exchange loss (gain) 1,209 706 (305) 11,406
Bonuses to directors (169) (150) (195) (1,594)
Equity in earnings of associated companies (1,700) (418) (533) (16,038)
Gain on transfer of business (488)
Other 566 842 632 5,340
Changes in assets and liabilities:
Decrease (increase) in notes and accounts receivable (4,997) 628 (915) (47,142)
Decrease in inventories 222 3,208 2,861 2,094
Decrease (increase) in interest and dividend receivable 101 (80) 194 953
Decrease (increase) in other current assets (1,961) 2,060 272 (18,500)
Increase (decrease) in notes and accounts payable 5,116 555 (4,180) 48,264
Increase in interest payable 34 12 1 320
Increase (decrease) in other current liabilities 1,719 1,247 (1,089) 16,217
Total adjustments 23,248 9,647 3,435 219,321
Net cash provided by operating activities 78,744 38,390 41,023 742,868
INVESTING ACTIVITIES:
Proceeds from sales of investment securities 102 321 1,631 962
Purchases of investment securities (379) (346) (119) (3,575)
Proceeds from sales of property, plant and equipment 814 2,254 480 7,679
Purchases of property, plant and equipment (23,212) (14,213) (19,001) (218,981)
Collection of loans 2,169 111 284 20,462
Payment of loans (2,475) (216) (125) (23,349)
Purchase of goodwill (3,300) (31,132)
Decrease in other assets 660 452 273 6,226
Increase in other assets (2,718) (2,840) (3,077) (25,641)
Proceeds from transfer of business 894
Net cash used in investing activities (28,339) (13,583) (19,654) (267,349)
FINANCING ACTIVITIES:
Net decrease in short-term borrowings (1,738) (1,265) (1,722) (16,396)
Proceeds from long-term bank loans 91
Repayments of long-term bank loans (44) (434) (126) (415)
Proceeds from sales of treasury stock 419 11 3,953
Payments for purchases of treasury stock (32,921) (7,036) (28) (310,576)
Dividends paid (8,588) (5,813) (6,412) (81,019)
Other 19 179
Net cash used in financing activities (42,853) (14,548) (8,186) (404,274)
Consolidated Statements of Cash Flows
Hoya Corporation and Subsidiaries
Years Ended March 31, 2004, 2003 and 2002