Pentax 2004 Annual Report Download - page 36
Download and view the complete annual report
Please find page 36 of the 2004 Pentax annual report below. You can navigate through the pages in the report by either clicking on the pages listed below, or by using the keyword search tool below to find specific information within the annual report.-
 1
1 -
2
-
3
-
4
-
5
-
6
-
7
-
8
-
9
-
10
-
11
-
12
-
13
-
14
-
15
-
16
-
17
-
18
-
19
-
20
-
21
-
22
-
23
-
24
-
25
-
 26
26 -
 27
27 -
 28
28 -
 29
29 -
 30
30 -
 31
31 -
 32
32 -
 33
33 -
 34
34 -
 35
35 -
 36
36 -
 37
37 -
 38
38 -
 39
39 -
 40
40 -
 41
41 -
 42
42 -
 43
43 -
 44
44 -
 45
45 -
 46
46 -
47
-
48
-
49
-
50
-
51
-
52
-
53
-
54
-
55
-
56
-
57
-
58
-
59
-
60
-
61
-
62
-
63
-
64
-
65
-
66
-
67
-
68
-
69
-
70
-
71
-
72
-
73
-
74
 |
 |

34
Review by Segment
Information Technology (Electro-Optics Division)
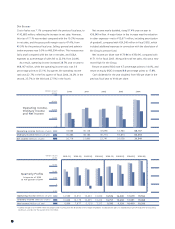
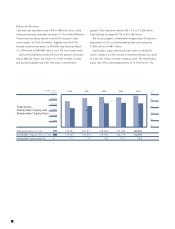
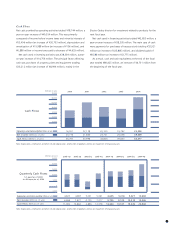
Net sales in the Electro-Optics division increased 21.2% year on year to
¥135,071 million. Sales of mask blanks for semiconductors rose, due to
the need for greater precision in the semiconductor market in general,
along with strong demand for high-precision products such as Hoya's
cutting-edge phase shift mask blanks. Sales of photomasks also rose
significantly. Sales of semiconductor photomasks were strong, driven
from an upswing in the semiconductor market on the back of strong
sales of digital consumer electronics, while sales of LCD photomasks rose
due to growing demand for LCD televisions and the establishment of
new production lines by manufacturers. In glass disks for HDDs, demand
increased due to a recovery in sales of personal computers and a
growing market for 1.0-inch and 1.8-inch small-diameter disks, leading
to a rise in sales. In optical products, the market for digital cameras and
other digital consumer electronics products expanded significantly during
the year, and sales of the Company's aspherical molded lenses and other
optical lenses rose, leading to an overall increase in sales.
Operating income for the Electro-Optics division rose 31.3% to
¥45,170 million. This increase was due to greater sales of high-value-
added products, and production plants operating at extremely high
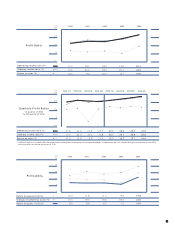
capacity in response to the favorable market. The operating income ratio
for the Electro-Optics division was 32.8% in the first quarter, 32.6% in
the second, 34.7% in the third, and 33.4% in the fourth, each quarter
representing a year-on-year increase. For the full fiscal year, the
operating income ratio rose to 33.4% from 30.8%.
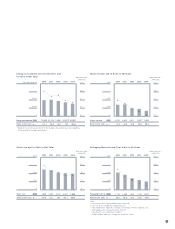
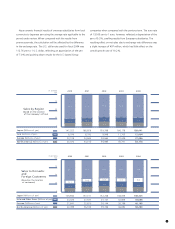
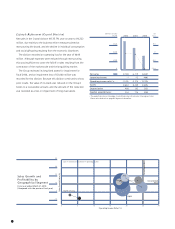
The Electro-Optics division's net sales growth rate increased signifi-
cantly during the term, to 21.2% from 9.8% for the previous year. The
graph labeled "Sales Growth and Profitability by Business Segment"
shows that the circle representing this segment has moved up the
vertical axis (representing the net sales growth rate) to a level above the
Group's net sales growth rate of 10.2%. The area of the circle has
increased due to the rise in operating income, while the circle has also
moved to the right along the horizontal axis (representing the operating
income ratio), due to the 2.6 percentage point increase in the operating
income ratio. The gains in both sales and profitability can be clearly seen.
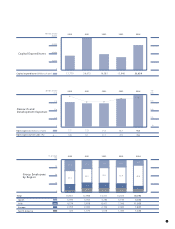
Capital expenditures for the Electro-Optics division increased
significantly compared with the previous fiscal year, to ¥22,247 million.
This was mainly due to investment in equipment for development of
next-generation products, and further purchases of equipment to
manufacture mask blanks and photomasks.
0
120,000
90,000
60,000
30,000
150,000 40.0
20.0
0
135,071
45,170
33.4%
132,240
13,205
22,247
101,496 111,461
27,789
27.3%
34,414
30.8%
111,806 114,877
12,687
13,280
13,129
10,444
(%)
20042002 2003
(Millions of yen)
Net sales
Operating income
Operating income ratio*
Assets
Depreciation
Capital expenditures
* The operating income ratio above is calculated using net sales plus intersegment sales.
Please refer to details on page 60 Segment Information.
30
40
20
10
0
-10
10 20 30 40
Sales Growth and
Profitability by
Business Segment
Fiscal year ended March 31, 2004
(Compared with the previous fiscal year)
Vision Care
Size of circle shows the volume of operating income.
Health Care
Electro-Optics
Sales Growth Ratio (%)
Operating Income Ratio (%)
Consolidated Basis
Consolidated Basis