Pentax 2004 Annual Report Download - page 38
Download and view the complete annual report
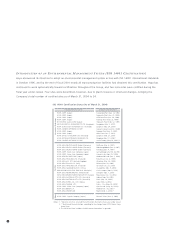
Please find page 38 of the 2004 Pentax annual report below. You can navigate through the pages in the report by either clicking on the pages listed below, or by using the keyword search tool below to find specific information within the annual report.-
 1
1 -
2
-
3
-
4
-
5
-
6
-
7
-
8
-
9
-
10
-
11
-
12
-
13
-
14
-
15
-
16
-
17
-
18
-
19
-
20
-
21
-
22
-
23
-
24
-
25
-
26
-
27
-
 28
28 -
 29
29 -
 30
30 -
 31
31 -
 32
32 -
 33
33 -
 34
34 -
 35
35 -
 36
36 -
 37
37 -
 38
38 -
 39
39 -
 40
40 -
 41
41 -
 42
42 -
 43
43 -
 44
44 -
 45
45 -
 46
46 -
 47
47 -
 48
48 -
49
-
50
-
51
-
52
-
53
-
54
-
55
-
56
-
57
-
58
-
59
-
60
-
61
-
62
-
63
-
64
-
65
-
66
-
67
-
68
-
69
-
70
-
71
-
72
-
73
-
74
 |
 |

36
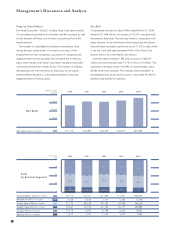
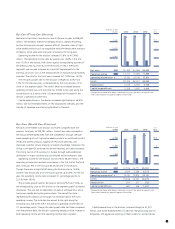
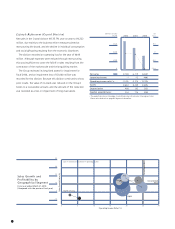
Lifestyle Refinement (Crystal Division)
Net sales in the Crystal division fell 35.7% year on year to ¥4,322
million, due mainly to the business reform measures aimed at
restructuring the brand, and the decline in individual consumption
and social gift giving resulting from the economic slowdown.
The division recorded an operating loss for the year of ¥496
million. Although expenses were reduced through restructuring,
this was insufficient to cover the falloff in sales resulting from the
contraction of the market scale and the languishing market.
The Group reviewed its long-lived assets for impairment for
fiscal 2004, and an impairment loss of ¥2,040 million was
recorded for this division. Because this division continued to show
poor results, the value of its assets was reduced on the Group's
books to a recoverable amount, and the amount of this reduction
was recorded as a loss on impairment of long-lived assets.
(%)
20042002 2003
(Millions of yen)
Net sales
Operating income
Operating income ratio*
Assets
Depreciation
Capital expenditures
*The operating income ratio above is calculated using net sales plus intersegment sales.
Please refer to details on page 60 Segment Information.
0
7,500
5,000
2,500
10,000 12.0
6.0
0
-6.0
-12.0
4,322
-496
-11.3%
2,805
352
224
8,788 6,719
-1
-0.0%
-12
-0.2%
8,684 8,409
498
254
302
776
30
40
20
10
0
-10
051015 20 25 30
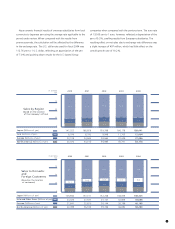
Sales Growth Ratio (%)
Operating Income Ratio (%)
North America
Asia
Europe
Japan
Consolidated Basis
Sales Growth and
Profitability by
Geographical Segment
Fiscal year ended March 31, 2004
(Compared with the previous fiscal year)
Size of circle shows the volume of operating income.
Consolidated
Basis