Pentax 2004 Annual Report Download - page 54
Download and view the complete annual report
Please find page 54 of the 2004 Pentax annual report below. You can navigate through the pages in the report by either clicking on the pages listed below, or by using the keyword search tool below to find specific information within the annual report.-
 1
1 -
2
-
3
-
4
-
5
-
6
-
7
-
8
-
9
-
10
-
11
-
12
-
13
-
14
-
15
-
16
-
17
-
18
-
19
-
20
-
21
-
22
-
23
-
24
-
25
-
26
-
27
-
28
-
29
-
30
-
31
-
32
-
33
-
34
-
35
-
36
-
37
-
38
-
39
-
40
-
41
-
42
-
43
-
 44
44 -
 45
45 -
 46
46 -
 47
47 -
 48
48 -
 49
49 -
 50
50 -
 51
51 -
 52
52 -
 53
53 -
 54
54 -
 55
55 -
 56
56 -
 57
57 -
 58
58 -
 59
59 -
 60
60 -
 61
61 -
 62
62 -
 63
63 -
 64
64 -
65
-
66
-
67
-
68
-
69
-
70
-
71
-
72
-
73
-
74
 |
 |

52
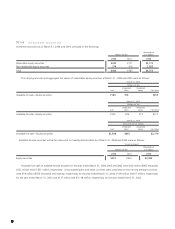
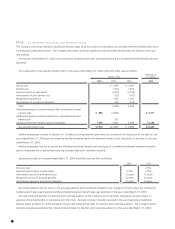
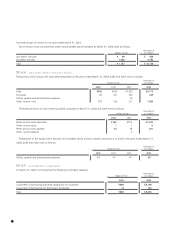
No»4INVESTMENT SECURITIES
Investment securities as of March 31, 2004 and 2003 consisted of the following:
Thousands of
Millions of Yen U.S. Dollars
2004 2003 2004
Marketable equity securities ¥230 ¥171 $2,170
Non-marketable equity securities 274 616 2,585
Total ¥504 ¥787 $4,755
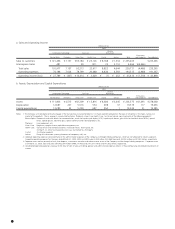
The carrying amounts and aggregate fair values of marketable equity securities at March 31, 2004 and 2003 were as follows:
March 31, 2004
Millions of Yen
Unrealized Unrealized
Cost Gains Losses Fair Value
Available-for-sale—Equity securities ¥160 ¥70 ¥230
March 31, 2003
Millions of Yen
Unrealized Unrealized
Cost Gains Losses Fair Value
Available-for-sale—Equity securities ¥145 ¥39 ¥13 ¥171
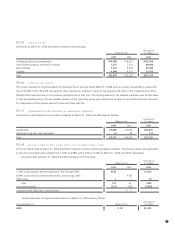
March 31, 2004
Thousands of U.S. Dollars
Unrealized Unrealized
Cost Gains Losses Fair Value
Available-for-sale—Equity securities $1,509 $661 $2,170
Available-for-sale securities whose fair value was not readily determinable as of March 31, 2004 and 2003 were as follows:
Carrying amount
Thousands of
Millions of Yen U.S. Dollars
2004 2003 2004
Equity securities ¥274 ¥616 $2,585
Proceeds from sales of available-for-sale securities for the years ended March 31, 2004, 2003 and 2002 were ¥102 million ($962 thousand),
¥321 million and ¥1,631 million, respectively. Gross realized gains and losses on these sales, computed on the moving average cost basis,
were ¥59 million ($556 thousand) and nothing, respectively, for the year ended March 31, 2004, ¥109 million and ¥7 million, respectively,
for the year ended March 31, 2003 and ¥137 million and ¥3,118 million, respectively, for the year ended March 31, 2002.
52