Pentax 2004 Annual Report Download - page 40
Download and view the complete annual report
Please find page 40 of the 2004 Pentax annual report below. You can navigate through the pages in the report by either clicking on the pages listed below, or by using the keyword search tool below to find specific information within the annual report.-
 1
1 -
2
-
3
-
4
-
5
-
6
-
7
-
8
-
9
-
10
-
11
-
12
-
13
-
14
-
15
-
16
-
17
-
18
-
19
-
20
-
21
-
22
-
23
-
24
-
25
-
26
-
27
-
28
-
29
-
 30
30 -
 31
31 -
 32
32 -
 33
33 -
 34
34 -
 35
35 -
 36
36 -
 37
37 -
 38
38 -
 39
39 -
 40
40 -
 41
41 -
 42
42 -
 43
43 -
 44
44 -
 45
45 -
 46
46 -
 47
47 -
 48
48 -
 49
49 -
 50
50 -
51
-
52
-
53
-
54
-
55
-
56
-
57
-
58
-
59
-
60
-
61
-
62
-
63
-
64
-
65
-
66
-
67
-
68
-
69
-
70
-
71
-
72
-
73
-
74
 |
 |

38
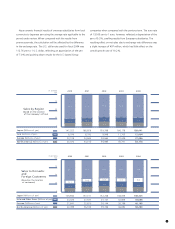
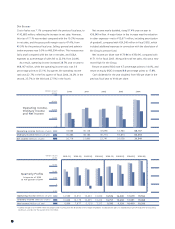
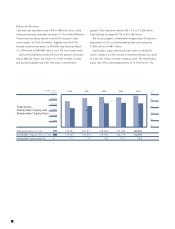
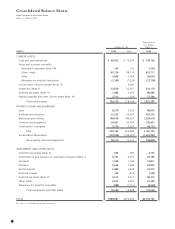
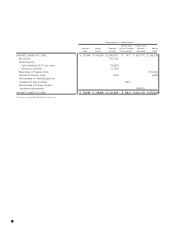
Financial Position
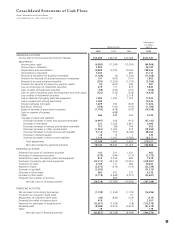
Cash and cash equivalents rose 6.3% to ¥80,425 million, while
notes and accounts receivable increased 15.5% to ¥69,598million.
These were the primary factors in the 8.5% increase in total
current assets, to ¥193,279 million. Together with the 0.5%
increase in noncurrent assets, to ¥96,608, total assets at March
31, 2004 stood at ¥289,887 million, up 5.7% from a year earlier.
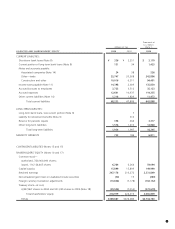
Total current liabilities rose 42.5% from the previous fiscal year-
end to ¥68,252 million, the result of a 33.9% increase in notes
and accounts payable and a 451.9% jump in income taxes
payable. Total long-term liabilities fell 3.1% to ¥1,934 million.
Total liabilities increased 40.7% to ¥70,186 million.
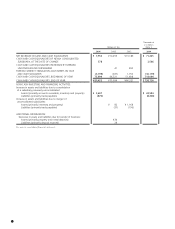
The Group's degree of indebtedness edged down 0.6 percent-
age points to 0.2%, as interest-bearing debt was reduced by
¥1,805 million to ¥487 million.
Shareholders' equity declined ¥5,240 million to ¥218,979
million, despite a 14.3% increase in retained earnings, as a result
of a ¥32,451 million increase in treasury stock. The shareholders'
equity ratio fell 6.2 percentage points, to 75.5% from 81.7%.
300,000
200,000
250,000
150,000
100,000
50,000
0
75.5
289,887
218,979
85
75
80
70
65
60
73.2 73.0 78.8 81.7
239,341 267,611 278,068
219,180175,146 195,333
274,289
224,219
Total assets (Millions of yen)
Shareholders’ equity (Millions of yen)
Shareholders’ equity ratio (%)
2004
Total Assets,
Shareholders’ Equity and
Shareholders’ Equity Ratio
(%)
2003200220012000
(Millions of yen)