Pentax 2004 Annual Report Download - page 33
Download and view the complete annual report
Please find page 33 of the 2004 Pentax annual report below. You can navigate through the pages in the report by either clicking on the pages listed below, or by using the keyword search tool below to find specific information within the annual report.-
 1
1 -
2
-
3
-
4
-
5
-
6
-
7
-
8
-
9
-
10
-
11
-
12
-
13
-
14
-
15
-
16
-
17
-
18
-
19
-
20
-
21
-
22
-
 23
23 -
 24
24 -
 25
25 -
 26
26 -
 27
27 -
 28
28 -
 29
29 -
 30
30 -
 31
31 -
 32
32 -
 33
33 -
 34
34 -
 35
35 -
 36
36 -
 37
37 -
 38
38 -
 39
39 -
 40
40 -
 41
41 -
 42
42 -
 43
43 -
44
-
45
-
46
-
47
-
48
-
49
-
50
-
51
-
52
-
53
-
54
-
55
-
56
-
57
-
58
-
59
-
60
-
61
-
62
-
63
-
64
-
65
-
66
-
67
-
68
-
69
-
70
-
71
-
72
-
73
-
74
 |
 |

31
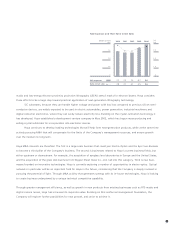
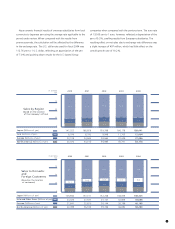
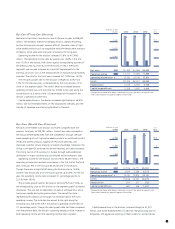
Hoya converts financial results of overseas subsidiaries from local
currencies to Japanese yen using the average rate applicable to the
period under review. When compared with the results from
previous periods, the calculation will be affected by the difference
in the exchange rate. The U.S. dollar rate used for fiscal 2004 was
112.76 yen to 1 U.S. dollar, reflecting an appreciation of the yen
of 7.0% and pushing down results for the U.S.-based Group
companies when compared with the previous term. The euro rate
of 132.65 yen to 1 euro, however, reflected a depreciation of the
yen of 9.2%, swelling results from European subsidiaries. The
resulting effect on net sales due to exchange rate differences was
a slight increase of ¥97 million, which had little effect on the
overall growth rate of 10.2%.
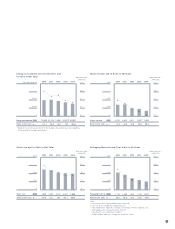
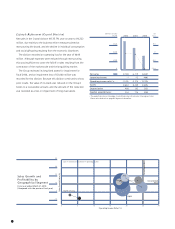
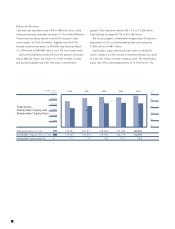
20042000 2001 2002 2003
(% of total)
Sales to Domestic
and
Foreign Customers
(Based on the location
of customers)
Japan (Millions of yen)
Asia and Other Areas (Millions of yen)
Europe (Millions of yen)
North America (Millions of yen)
100
75
50
25
0
148,325
44,668
40,168
38,283
54.6
16.5
14.8
14.1
126,844 137,211 132,248 138,006
24,326 27,537 25,127 32,806
27,841 35,870 38,144 38,789
22,099 36,184 39,746 36,692
63.1
12.1
13.8
11.0
56.0
13.3
15.8
14.9
56.2
10.7
16.2
16.9
57.9
11.6
15.2
15.3
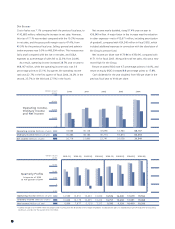
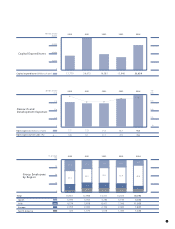
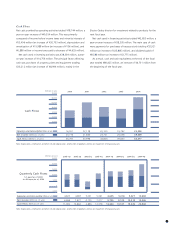
20042000 2001 2002 2003
(% of total)
Sales by Region
Japan (Millions of yen)
Asia (Millions of yen)
Europe (Millions of yen)
North America (Millions of yen)
(Based on the location
of the Company’s offices)
100
75
50
25
0
188,441
12,404
37,486
33,113
69.4
4.6
13.8
12.2
147,553 168,856 159,368 166,178
8,076 8,792 9,948 11,705
23,109 24,944 28,964 32,639
22,372 34,210 36,985 35,771
73.4
4.0
11.5
11.1
67.5
4.8
13.2
14.5
67.8
4.2
12.3
15.7
71.3
3.7
10.5
14.5