Pentax 2004 Annual Report Download - page 64
Download and view the complete annual report
Please find page 64 of the 2004 Pentax annual report below. You can navigate through the pages in the report by either clicking on the pages listed below, or by using the keyword search tool below to find specific information within the annual report.-
 1
1 -
2
-
3
-
4
-
5
-
6
-
7
-
8
-
9
-
10
-
11
-
12
-
13
-
14
-
15
-
16
-
17
-
18
-
19
-
20
-
21
-
22
-
23
-
24
-
25
-
26
-
27
-
28
-
29
-
30
-
31
-
32
-
33
-
34
-
35
-
36
-
37
-
38
-
39
-
40
-
41
-
42
-
43
-
44
-
45
-
46
-
47
-
48
-
49
-
50
-
51
-
52
-
53
-
 54
54 -
 55
55 -
 56
56 -
 57
57 -
 58
58 -
 59
59 -
 60
60 -
 61
61 -
 62
62 -
 63
63 -
 64
64 -
 65
65 -
 66
66 -
 67
67 -
 68
68 -
 69
69 -
 70
70 -
 71
71 -
 72
72 -
 73
73 -
 74
74
 |
 |

62
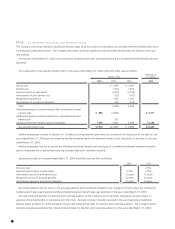
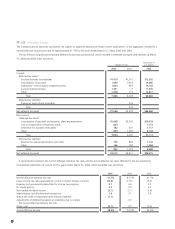
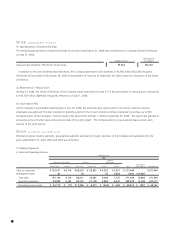
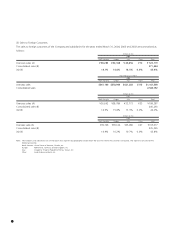
a. Sales and Operating Income
Millions of Yen
2002
Lifestyle
Information Technology Eye Care Refinement
Eliminations
Electro-Optics Photonics Vision Care Health Care Crystal Service Total and Corporate Consolidated
Sales to customers ¥ 101,496 ¥ 7,157 ¥ 93,184 ¥ 23,106 ¥ 8,788 ¥ 1,534 ¥ 235,265 ¥235,265
Intersegment sales 481 29 811 35 3,110 4,466 ¥(4,466)
Total sales 101,977 7,157 93,213 23,917 8,823 4,644 239,731 (4,466) 235,265
Operating expenses 74,188 7,624 78,799 20,488 8,824 4,392 194,315 (2,948) 191,367
Operating income (loss) ¥ 27,789 ¥ (467) ¥ 14,414 ¥ 3,429 ¥ (1) ¥ 252 ¥ 45,416 ¥ (1,518) ¥ 43,898
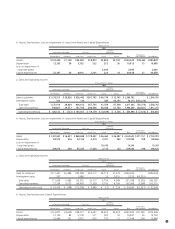
b. Assets, Depreciation and Capital Expenditures
Millions of Yen
2002
Lifestyle
Information Technology Eye Care Refinement
Eliminations
Electro-Optics Photonics Vision Care Health Care Crystal Service Total and Corporate Consolidated
Assets ¥ 111,806 ¥ 4,515 ¥ 92,309 ¥ 15,816 ¥ 8,684 ¥ 3,445 ¥ 236,575 ¥41,493 ¥278,068
Depreciation 12,687 227 5,516 554 498 37 19,519 117 19,636
Capital expenditures 13,280 53 5,259 687 254 1 19,534 51 19,585
Notes: 1. The Company and subsidiaries primarily engage in the manufacture and sale of products in six major segments grouped on the basis of similarities in the types, nature and
market of the products. The six segments, namely, Electro-Optics, Photonics, Vision Care, Health Care, Crystal and Service, consist primarily of the following products:
Electro-Optics: Photomasks and mask blanks for semiconductors, masks for liquid-crystal display (LCD), liquid-crystal devices, glass disks for hard disk drives (HDDs), optical
lenses, optical glasses, electronic glass, optical communication related products, etc.
Photonics: Laser equipment, etc.
Vision Care: Eyeglasses, eyeglass frames, ophthalmic equipment, etc.
Health Care: Contact lenses and related accessories, intraocular lenses, hearing aids, etc.
On March 31, 2003, hearing aids business was transferred to a third party.
Crystal: Crystal glass products
Service: Design of information systems, placement of temporary staff, etc.
2. Corporate operating expenses consist primarily of the administration expenses of the Company and foreign holding companies, which are not allocated to industry segments.
Corporate operating expenses for the years ended March 31, 2004, 2003 and 2002 were ¥2,424 million ($22,868 thousand), ¥2,052 million and ¥1,981 million, respectively.
3. Corporate assets consist primarily of cash, time deposits, investments securities and administrative assets of the Company and the foreign holding companies. Corporate assets
as of March 31, 2004, 2003 and 2002 were ¥52,594 million ($496,170 thousand), ¥51,571 million and ¥51,632 million, respectively.
4. Consolidated operating expenses are equal to the total of cost of sales and selling, general and administrative expenses shown in the accompanying consolidated statements of
income.