Office Depot 2001 Annual Report Download - page 53
Download and view the complete annual report
Please find page 53 of the 2001 Office Depot annual report below. You can navigate through the pages in the report by either clicking on the pages listed below, or by using the keyword search tool below to find specific information within the annual report.-
 1
1 -
2
-
3
-
4
-
5
-
6
-
7
-
8
-
9
-
10
-
11
-
12
-
13
-
14
-
15
-
16
-
17
-
18
-
19
-
20
-
21
-
22
-
23
-
24
-
25
-
26
-
27
-
28
-
29
-
30
-
31
-
32
-
33
-
34
-
35
-
36
-
37
-
38
-
39
-
40
-
41
-
42
-
 43
43 -
 44
44 -
 45
45 -
 46
46 -
 47
47 -
 48
48 -
 49
49 -
 50
50 -
 51
51 -
 52
52 -
 53
53 -
 54
54 -
 55
55 -
 56
56
 |
 |

51
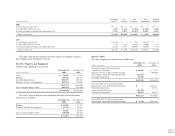
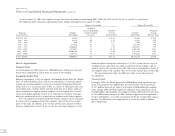
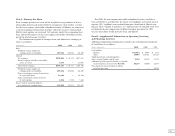
We sell office products and services through either wholly-owned opera-
tions or through joint ventures or licensing arrangements, in Australia, Austria,
Belgium, Canada, France, Germany, Hungary, Ireland, Israel, Italy, Japan,
Luxembourg, Mexico, The Netherlands, Poland, Thailand, the United Kingdom
and the United States. Also from 1993 through the fourth quarter of 2000,
we had operations in Columbia under a licensing agreement. There is no
single country outside of the United States in which we generate 10% or
more of our total revenues. Summarized financial information relating to our
operations is as follows (dollars in thousands):
Sales Assets
2001 2000 1999 2001 2000
United States $ 9,452,453 $ 9,901,975 $ 8,743,428 $3,585,843 $3,391,678
International 1,701,628 1,667,721 1,528,632 745,800 804,656
Total $11,154,081 $11,569,696 $10,272,060 $4,331,643 $4,196,334
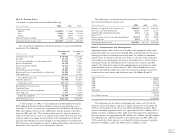
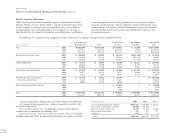
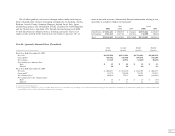
Note M—Quarterly Financial Data (Unaudited)
First Second Third Fourth
(In thousands, expect per share amounts) Quarter Quarter Quarter Quarter
Fiscal Year Ended December 29, 2001
Net sales $3,017,914 $2,553,503 $2,782,493 $2,800,171
Gross profit(1) 806,851 738,570 808,491 816,196
Net earnings 56,329 41,974 62,460 40,280
Net earnings per common share:
Basic $ .19 $ .14 $ .21 $ .13
Diluted .19 .14 .20 .13
Fiscal Year Ended December 30, 2000
Net sales $ 3,065,657 $ 2,632,850 $ 2,822,991 $ 3,048,198
Gross profit(1) 837,576 751,550 735,151 765,983
Net earnings (loss) 109,036 57,937 50,622 (168,263)
Net earnings (loss) per common share:
Basic $ .34 $ .18 $ .17 $ (.57)
Diluted(2) .32 .18 .16 (.57)
(1) Gross profit is net of occupancy costs.
(2) For the fourth quarter of 2000, the zero coupon, convertible subordinated notes were anti-dilutive and, accordingly, were not included in the diluted earnings per share computations. In addition, for the fourth quarter of 2000, options to purchase common stock
were anti-dilutive and not included in the diluted earnings per share computations.