Office Depot 2001 Annual Report Download - page 49
Download and view the complete annual report
Please find page 49 of the 2001 Office Depot annual report below. You can navigate through the pages in the report by either clicking on the pages listed below, or by using the keyword search tool below to find specific information within the annual report.-
 1
1 -
2
-
3
-
4
-
5
-
6
-
7
-
8
-
9
-
10
-
11
-
12
-
13
-
14
-
15
-
16
-
17
-
18
-
19
-
20
-
21
-
22
-
23
-
24
-
25
-
26
-
27
-
28
-
29
-
30
-
31
-
32
-
33
-
34
-
35
-
36
-
37
-
38
-
 39
39 -
 40
40 -
 41
41 -
 42
42 -
 43
43 -
 44
44 -
 45
45 -
 46
46 -
 47
47 -
 48
48 -
 49
49 -
 50
50 -
 51
51 -
 52
52 -
 53
53 -
 54
54 -
 55
55 -
 56
56
 |
 |

47
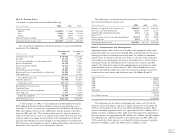
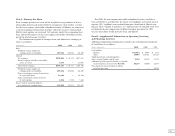
Accounting for Stock-Based Compensation
The Company applies Accounting Principles Board Opinion No. 25, “Account-
ing for Stock Issued to Employees,” and related Interpretations in accounting
for stock-based compensation plans. The compensation cost charged against
income for the Long-Term Equity Incentive Plan, Long-Term Incentive Stock
Plan, Employee Stock Purchase Plans and retirement savings plans approxi-
mated $9.4 million, $11.2 million and $12.5 million in 2001, 2000 and 1999,
respectively. No other compensation costs have been recognized under our
stock-based compensation plans. Had compensation cost for awards under
our stock-based compensation plans been determined using the fair value
method prescribed by SFAS No. 123, “Accounting for Stock-Based Compensation,”
our net earnings and earnings per share would have been reduced to the
pro forma amounts presented below:
(In thousands, except per share amounts) 2001 2000 1999
Net earnings
As reported $201,043 $49,332 $257,638
Pro forma 165,068 11,253 226,424
Basic earnings per share
As reported $ .67 $ .16 $ .71
Pro forma .55 .04 .63
Diluted earnings per share
As reported $ .66 $ .16 $ .69
Pro forma .54 .04 .61
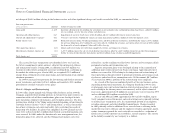
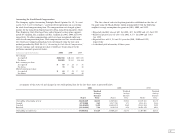
The fair value of each stock option granted is established on the date of
the grant using the Black-Scholes option pricing model with the following
weighted average assumptions for grants in 2001, 2000, and 1999:
• Expected volatility rates of 40% for 2001, 40% for 2000 and 35% for 1999
• Risk-free interest rates of 4.58% for 2001, 6.37% for 2000 and 5.84%
for 1999
• Expected lives of 4.9, 5.6 and 5.6 years for 2001, 2000 and 1999,
respectively
• A dividend yield of zero for all three years
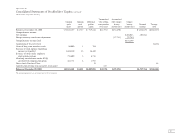
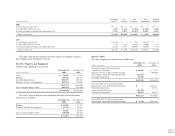
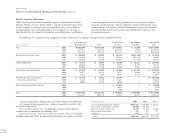
A summary of the status of and changes in our stock option plans for the last three years is presented below.
2001 2000 1999
Weighted Weighted Weighted
Average Average Average
Exercise Exercise Exercise
Shares Price Shares Price Shares Price
Outstanding at beginning of year 36,406,229 $12.81 33,507,066 $15.31 31,369,122 $13.75
Granted 6,759,000 9.41 9,937,750 8.73 8,123,883 18.85
Canceled (2,642,428) 13.99 (6,608,072) 16.45 (1,325,988) 15.91
Exercised (5,522,280) 7.93 (430,515) 6.18 (4,659,951) 10.31
Outstanding at end of year 35,000,521 $13.29 36,406,229 $12.81 33,507,066 $15.31