Office Depot 2001 Annual Report Download - page 23
Download and view the complete annual report
Please find page 23 of the 2001 Office Depot annual report below. You can navigate through the pages in the report by either clicking on the pages listed below, or by using the keyword search tool below to find specific information within the annual report.-
 1
1 -
2
-
3
-
4
-
5
-
6
-
7
-
8
-
9
-
10
-
11
-
12
-
 13
13 -
 14
14 -
 15
15 -
 16
16 -
 17
17 -
 18
18 -
 19
19 -
 20
20 -
 21
21 -
 22
22 -
 23
23 -
 24
24 -
 25
25 -
 26
26 -
 27
27 -
 28
28 -
 29
29 -
 30
30 -
 31
31 -
 32
32 -
 33
33 -
34
-
35
-
36
-
37
-
38
-
39
-
40
-
41
-
42
-
43
-
44
-
45
-
46
-
47
-
48
-
49
-
50
-
51
-
52
-
53
-
54
-
55
-
56
 |
 |

21
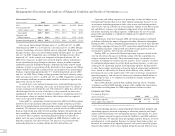
percentage in 2000 compared to 1999. These two product groups accounted
for approximately 34% of our total sales mix in 2000.
Store and warehouse operating and selling expenses consist of personnel
costs; maintenance and other facility costs; advertising expenses; delivery and
transportation costs; credit card and bank charges and certain other operating
and selling costs. These costs, expressed as a percentage of sales, increased
in both 2001 and 2000. The increase in 2001 reflects the impact of declining
sales on the ratio, while the increase in 2000 is primarily the result of higher
personnel and warehouse costs. In 2001, we scaled back our personnel-related
costs in response to weaker sales. Other expenses, such as credit card fees and
delivery fees, have also declined along with sales. In 2000, however, we expe-
rienced higher delivery- and personnel-related costs in our warehouse opera-
tions as third-party carriers increased their rates, and our facility integration
efforts took longer to complete than originally planned. We also had a signifi-
cant increase during 2000 in personnel expenses in our domestic stores, largely
related to wage pressures stemming from a tight labor market. Also included
in this category are certain charges and credits that affect the comparisons of
on-going operations and are more fully discussed below.
Charges and Credits
Our financial results were significantly affected in 2001, 2000 and 1999 by
charges and credits that do not relate to on-going sales and service activities.
Charges recorded in 2000 were the largest and provide a context for some of
the charges in 2001. During the latter half of 2000, we conducted a compre-
hensive business review of all aspects of our business. Commitments made at
that time resulted in a significant change in the Company’s strategic direction
and led to modifications of our important business practices. Among other
things, the review resulted in a decision to close 70 under-performing North
American retail stores, close and relocate two warehouses, invest in new
warehouse technologies, reduce the number of slower-moving SKUs in our
retail stores and North American warehouses and modify business practices
to increase efficiency. A total net charge of $260.6 million was recorded and is
summarized in the table below. Included in the $174.7 million facility-related
charge is $110.0 million in facility closure costs and $64.7 million for the
write-down of other impaired assets and related exit costs. Other business
review charges included $38.4 million for inventory reductions, a net $10.5
million provision for sales returns and allowances and $12.6 million for the
disposal of certain fixed assets. Also in 2000, we recorded $32.5 million in
severance costs, primarily related to changes in senior management, and a
net $6.8 million credit to adjust a previous merger accrual for improved
estimates of actual costs. Outside of operations, we recorded impairment
charges of $11.1 million relating to goodwill in Japan and $45.5 million of
other than temporary declines in the value of certain Internet investments.
Earlier in 2000, we also realized a $57.9 million gain on the sale of certain
Internet investments.
During 2001, we closed 73 stores, 70 of which were identified as part of
our comprehensive business review. We also identified 10 additional under-
performing stores to be closed in 2002. Charges of $43.6 million were recorded
for asset impairments relating to these stores, and to adjust estimated lease
termination costs recorded in 2000 resulting from a softening in the market
for retail space subleases, partially offset by a $10.2 million gain on sale of a
warehouse. We also reached settlement of certain non-recurring legal claims
and recognized amortization of an existing retention agreement. Non-operating
expenses included charges of $14.1 million, primarily to recognize an addi-
tional other than temporary decline in value of certain Internet investments.
As of the end of 2001, our Internet investment portfolio was carried at
$15.2 million.
In late 1999, we changed our method of accounting for revenue generated
from sales of extended service warranty contracts. Under the laws of certain
states, we are obligated to assume the risk of loss associated with such con-
tracts. In these states, we modified our accounting to recognize revenue for
warranty service contract sales over the service period, which typically
extends over a period of one to four years. In those states where we are not
the legal obligor, we modified our accounting to recognize warranty revenues
after deducting the related direct costs. This change resulted in a reduction in
our 1999 gross profit of $15.8 million.
Also in 1999, we recorded a charge of $56.1 million to establish a provi-
sion for slow-moving and obsolete inventories and we recorded facility clo-
sure charges of $40.4 million to reflect our decision to accelerate our store
closure program for under-performing stores and our relocation program for
older stores in our North American Retail Division.
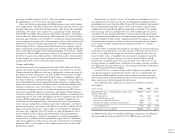
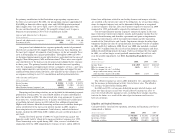
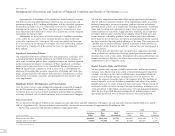
The following tables summarize the charges and credits by category
and segment:
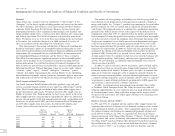
(Dollars in millions) 2001 2000 1999
Earnings before taxes, excluding non-recurring items $377.5 $353.0 $519.1
Charges and credits:
Facility-related, net 33.4 174.7 40.4
Other 2000 business review —61.5 —
Legal, merger and other operating 15.9 25.7 64.8
Internet investments and other non-operating 14.1 (1.3) —
Total charges, net 63.4 260.6 105.2
Earnings before taxes as reported $314.1 $ 92.4 $413.9
See Note B of the Notes to Consolidated Financial Statements for additional
discussion and line item presentation of the 2000 charges and credits.