Office Depot 2001 Annual Report Download - page 52
Download and view the complete annual report
Please find page 52 of the 2001 Office Depot annual report below. You can navigate through the pages in the report by either clicking on the pages listed below, or by using the keyword search tool below to find specific information within the annual report.-
 1
1 -
2
-
3
-
4
-
5
-
6
-
7
-
8
-
9
-
10
-
11
-
12
-
13
-
14
-
15
-
16
-
17
-
18
-
19
-
20
-
21
-
22
-
23
-
24
-
25
-
26
-
27
-
28
-
29
-
30
-
31
-
32
-
33
-
34
-
35
-
36
-
37
-
38
-
39
-
40
-
41
-
 42
42 -
 43
43 -
 44
44 -
 45
45 -
 46
46 -
 47
47 -
 48
48 -
 49
49 -
 50
50 -
 51
51 -
 52
52 -
 53
53 -
 54
54 -
 55
55 -
 56
56
 |
 |

50
Office Depot, Inc.
Notes to Consolidated Financial Statements (continued)
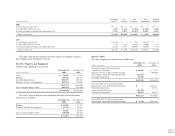
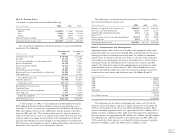
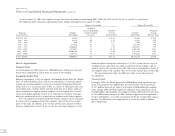
Note L—Segment Information
Office Depot operates in three reportable segments: North American Retail
Division, Business Services Group (“BSG”), and International Division. Each
of these segments is managed separately primarily because it serves different
customer groups. The accounting policies of our segments are the same as
those described in the summary of significant accounting policies (see Note A).
Senior management evaluates the performance of each business segment
based on operating income, which is defined as income before income taxes,
interest income and expense, goodwill amortization, merger and restructur-
ing costs, facility closure costs, general and administrative expenses, and
pre-opening expenses.
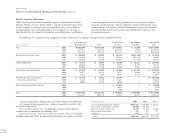
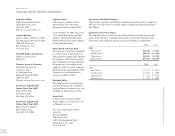
The following is a summary of our significant accounts and balances by segment, reconciled to our consolidated totals.
North American International Eliminations Consolidated
(Dollars in thousands) Retail Division BSG Division and Other* Total
Sales 2001 $5,842,648 $3,763,006 $1,552,072 $ (3,645) $11,154,081
2000 6,487,522 3,618,768 1,467,357 (3,951) 11,569,696
1999 5,893,385 3,057,187 1,325,372 (3,884) 10,272,060
Earnings Before Income Taxes 2001 $ 300,082 $ 285,101 $ 227,336 $(498,389) $ 314,130
2000 239,284 191,996 173,438 (512,259) 92,459
1999 399,120 256,045 136,488 (377,766) 413,887
Capital Expenditures 2001 $ 76,337 $ 44,087 $ 56,740 $ 30,123 $ 207,287
2000 106,646 55,690 32,994 72,398 267,728
1999 195,048 71,810 35,766 89,681 392,305
Depreciation and Amortization 2001 $ 88,227 $ 45,699 $ 16,866 $ 48,642 $ 199,434
2000 92,276 42,588 18,797 52,049 205,710
1999 76,982 35,093 15,619 43,389 171,083
Provision for Losses on Accounts 2001 $ 35,739 $ 53,712 $ 20,109 — $ 109,560
Receivable and Inventory 2000 30,121 57,628 33,477 — 121,226
1999 60,003 65,053 20,940 — 145,996
Equity in Earnings of Joint Ventures 2001 —— $ 10,892 — $ 10,892
2000 —— 9,436 — 9,436
1999 —— 2,041 — 2,041
Assets 2001 $1,803,042 $1,198,355 $ 864,201 $ 466,045 $ 4,331,643
2000 2,184,976 1,105,936 736,229 169,193 4,196,334
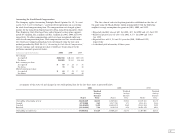
*Amounts included in ‘Eliminations and Other’ consist of the following:
Sales consist of inter-segment sales, which are generally recorded at the
cost to the selling entity.
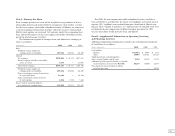
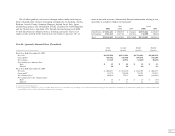
Earnings Before Income Taxes are primarily associated with corporate
activities and are detailed in the following table:
Capital Expenditures, Depreciation and Amortization, and Assets included
in
‘
Eliminations and Other’ are also related primarily to our corporate activities.
(Dollars in thousands) 2001 2000 1999
General and administrative expenses $451,722 $501,700 $381,611
Loss (gain) on investment securities 14,100 (12,414) —
Interest (income) expense, net 31,199 22,399 (4,028)
Intersegment transactions 711 257 183
Other, net 657 317 —
Total $498,389 $512,259 $377,766