Office Depot 2001 Annual Report Download - page 24
Download and view the complete annual report
Please find page 24 of the 2001 Office Depot annual report below. You can navigate through the pages in the report by either clicking on the pages listed below, or by using the keyword search tool below to find specific information within the annual report.-
 1
1 -
2
-
3
-
4
-
5
-
6
-
7
-
8
-
9
-
10
-
11
-
12
-
13
-
 14
14 -
 15
15 -
 16
16 -
 17
17 -
 18
18 -
 19
19 -
 20
20 -
 21
21 -
 22
22 -
 23
23 -
 24
24 -
 25
25 -
 26
26 -
 27
27 -
 28
28 -
 29
29 -
 30
30 -
 31
31 -
 32
32 -
 33
33 -
 34
34 -
35
-
36
-
37
-
38
-
39
-
40
-
41
-
42
-
43
-
44
-
45
-
46
-
47
-
48
-
49
-
50
-
51
-
52
-
53
-
54
-
55
-
56
 |
 |

22
Office Depot, Inc.
Management’s Discussion and Analysis of Financial Condition and Results of Operations(continued)
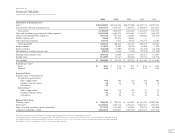
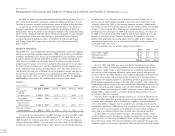
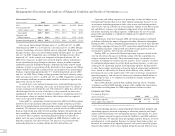
(Dollars in millions) 2001 2000 1999
Distribution of charges and credits by segment:
North American Retail Division $ 43.6 $201.1 $ 88.3
BSG —8.6 (12.2)
International Division (10.2) 18.7 29.1
Other—Corporate 30.0 32.2 —
Total $ 63.4 $260.6 $105.2
After considering the effect of income taxes, the impact of these net
charges on our net earnings was $41.0 million, $172.9 million and $69.3 mil-
lion for 2001, 2000, and 1999, respectively.
The components of segment operating profit presented below include the
charges and credits outlined above. Additionally, certain expenses, primarily
payroll-related, previously recorded in total company general and administra-
tive expenses have been reclassified to determine segment operating profit
beginning in 2001. Prior year amounts reflect the reclassification of these costs.
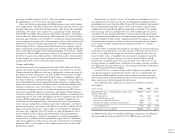
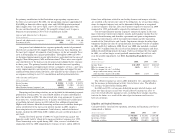
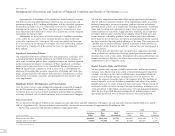
North American Retail Division
(Dollars in millions) 2001 2000 1999
Sales $5,842.6 100.0% $6,487.5 100.0% $5,893.4 100.0%
Cost of goods sold
and occupancy costs 4,479.1 76.7% 5,065.0 78.1% 4,556.5 77.3%
Gross profit 1,363.5 23.3% 1,422.5 21.9% 1,336.9 22.7%
Operating and
selling expenses 1,046.7 17.9% 1,101.7 17.0% 923.2 15.7%
Segment operating profit $ 316.8 5.4% $ 320.8 4.9% $ 413.7 7.0%
Sales in our North American Retail Division decreased 10% in 2001 and
increased 10% in 2000. Adjusting fiscal 2000 results to remove the 53rd week,
sales decreased 8% in 2001. The decrease was experienced across all regions
of the country and reflects the adverse effect of the weak U.S. economy.
Additionally, the sales decline during 2001 reflects the closing of 73 stores
identified as under-performing stores as part of the comprehensive business
review in late 2000. The sales increase in 2000 was primarily achieved through
our store expansion program. For 2001, comparable sales in the 816 stores
that had been open for more than one year were down 8%. In 2000, compa-
rable sales were essentially even with 1999.
While sales decreased in 2001, gross profit expressed as a percent of sales
increased. Sales shifted away from lower-margin computer hardware, software
and office furniture and into products such as machine and office supplies,
as well as additional copy center services. Sales of computer products declined
26% in 2001 compared with an increase of 3% in 2000, reflecting declines in
both volume and average unit price. We are unable to predict when, and to
what extent, this trend will reverse. During 1999, we offered low priced units
and more aggressive promotional programs on computer products, including
an instant rebate program when the customer contracted for Internet service,
which resulted in strong sales for that year at lower margin percentages. The
Internet service provider instant rebate program was in effect for portions of
2000 and 2001. The sale of business furniture declined 16% in 2001, after
increasing 14% in 2000. The decrease in 2001 is consistent with the slowing
economy and decisions to cancel or defer office-related purchases. The sale
of business machine supplies increased in both periods.
Lower margins realized on paper and machine supplies contributed most
notably to the decrease in gross profit in 2000 compared to 1999. Increased
costs of these core products and decreased prices in response to competitive
pressures negatively impacted gross profit. Also in 2000, sales increases in the
North American Retail Division were not sufficient to leverage the additional
fixed expenses incurred with the addition of new stores. Gross profit includes
fixed costs such as occupancy and rental costs for equipment in our print
and copy centers.
A significant portion of the comprehensive business review completed
at the end of 2000 was focused on the North American Retail Division and,
among other things, included a commitment to enhance the shoppers’ exper-
ience in our retail stores. To that end, we implemented a Division-wide
re-merchandising campaign that included personnel training, improved sign-
age and lighting, improved product adjacencies and additional private label
merchandise. Also, as a result of the business review, we closed 70 under-
performing stores in early 2001 and another three later in the year. The table
above includes charges and credits reported in line items through segment
operating profit. In 2000, these charges include $29.5 million to provide for
sales returns and allowances, $10.1 million for inventory adjustments and
$57.8 million relating to asset impairments and write-downs. Additional
charges and credits relating to the North American Retail Division, such as
facility closure costs, were reported on line items below segment operating
profit and are discussed in the Charges and Credits section above. Fiscal
year 2001 includes $35.2 million of charges relating to additional store closures
and impairments from 13 additional under-performing stores, three of which
were closed during the year.
In our North American Retail Division, the largest components of operat-
ing and selling expenses are personnel, facility, advertising and credit card
expenses. Each of these components declined in 2001; and total operating and
selling expenses, excluding the charges outlined above, decreased 3% in 2001.
Personnel costs, which represent over 50% of the total costs in this caption,
showed the largest decline as payroll was adjusted down in response to declin-
ing sales and from a net reduction in stores. Personnel costs in 2000 were
higher than in 1999, primarily because of competitive wage pressure and the
need to attract more highly skilled employees in certain positions. Addition-
ally, rent and depreciation expense decreased in 2001 from store closings,
partially offset by adding 44 stores during the year. Lower sales in 2001 also