Office Depot 2001 Annual Report Download - page 2
Download and view the complete annual report
Please find page 2 of the 2001 Office Depot annual report below. You can navigate through the pages in the report by either clicking on the pages listed below, or by using the keyword search tool below to find specific information within the annual report.-
 1
1 -
 2
2 -
 3
3 -
 4
4 -
 5
5 -
 6
6 -
 7
7 -
 8
8 -
 9
9 -
 10
10 -
 11
11 -
 12
12 -
 13
13 -
14
-
15
-
16
-
17
-
18
-
19
-
20
-
21
-
22
-
23
-
24
-
25
-
26
-
27
-
28
-
29
-
30
-
31
-
32
-
33
-
34
-
35
-
36
-
37
-
38
-
39
-
40
-
41
-
42
-
43
-
44
-
45
-
46
-
47
-
48
-
49
-
50
-
51
-
52
-
53
-
54
-
55
-
56
 |
 |

FFICE DEPOT, INC.is the world’s largest supplier of office products and services. The Company sells office sup-
plies, business machines, computers, computer software and office furniture, as well as copy, print, reproduction,
mailing and shipping services to small office/home office (SoHo), medium and large businesses in the United States and 17 other
countries around the globe. Office Depot operates under brand names Office DepotT, Viking Office ProductsT, Viking DirectT,
4Sure.comT, Computers4Sure.comT, Solutions4Sure.comT, The Office PlaceT, and Sands & McDougallE. The Company markets its
products through multiple distribution channels, including office supply retail stores, direct mail, global Internet sites, business-to-
business e-commerce, and various sales forces. Office Depot has approximately 45,000 employees, and its common stock is traded
on the New York Stock Exchange under symbol ODP.
O
•RESPECT
FOR THE
INDIVIDUAL
•FANATICAL
CUSTOMER
SERVICE
•EXCELLENCE
IN EXECUTION
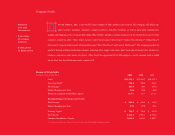
2001 2000 1999
Sales(1) $11,154.1 $11,569.7 $10,272.1
Operating Profit(1) 354.4 110.2 413.4
Net Earnings 201.0 49.3 257.6
Diluted Earnings per Share 0.66 0.16 0.69
Return on Common Stockholders’ Equity 11.7% 2.8% 13.1%
Excluding Impact of Charges and Credits
Net Earnings $ 242.0 $ 222.2 $ 326.9
Diluted Earnings per Share 0.79 0.70 0.86
Working Capital $ 704.7 $ 790.8 $ 687.0
Total Assets 4,331.6 4,196.3 4,276.2
Common Stockholders’ Equity 1,848.4 1,601.3 1,907.7
(1) Certain amounts in prior year financial statements have been reclassified to conform to current year presentation.
Financial Highlights
(in millions, except per share data)
Company Profile