Loreal 2015 Annual Report Download - page 17
Download and view the complete annual report
Please find page 17 of the 2015 Loreal annual report below. You can navigate through the pages in the report by either clicking on the pages listed below, or by using the keyword search tool below to find specific information within the annual report.-
 1
1 -
2
-
3
-
4
-
5
-
6
-
 7
7 -
 8
8 -
 9
9 -
 10
10 -
 11
11 -
 12
12 -
 13
13 -
 14
14 -
 15
15 -
 16
16 -
 17
17 -
 18
18 -
 19
19 -
 20
20 -
 21
21 -
 22
22 -
 23
23 -
 24
24 -
 25
25 -
 26
26 -
 27
27 -
28
-
29
-
30
-
31
-
32
-
33
-
34
-
35
-
36
-
37
-
38
-
39
-
40
-
41
-
42
-
43
-
44
-
45
-
46
-
47
-
48
-
49
-
50
-
51
-
52
-
53
-
54
-
55
-
56
-
57
-
58
-
59
-
60
 |
 |
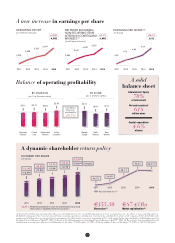
A dynamic shareholder return policy
(1) Net profit excluding non-recurring items after non-controlling interests does not include impairment of assets, restructuring costs, tax effects or non-controlling interests.
(2) Diluted earnings per share, based on net profit from continuing operations, excluding non-recurring items, attributable to owners of the company. (3) For shareholders who
continuously hold their shares in registered form for a minimum of two full calendar years, up to a maximum of 0.5% of the capital for the same shareholder. (4) Dividend proposed at
the Annual General Meeting of April 20th, 2016. (5) Based on the dividend proposed at the Annual General Meeting of April 20th, 2016. (6) Pay-out ratio based on diluted net profit
excluding non-recurring items, after non-controlling interests, per share. (7) At December 31st, 2015. (8) On the number of shares at December 31st, 2015, i.e. 562,983,348 shares.
DIVIDEND PER SHARE
(in euros)
e155.30
Share price (7)
e87.43 Bn
Market capitalisation (8)
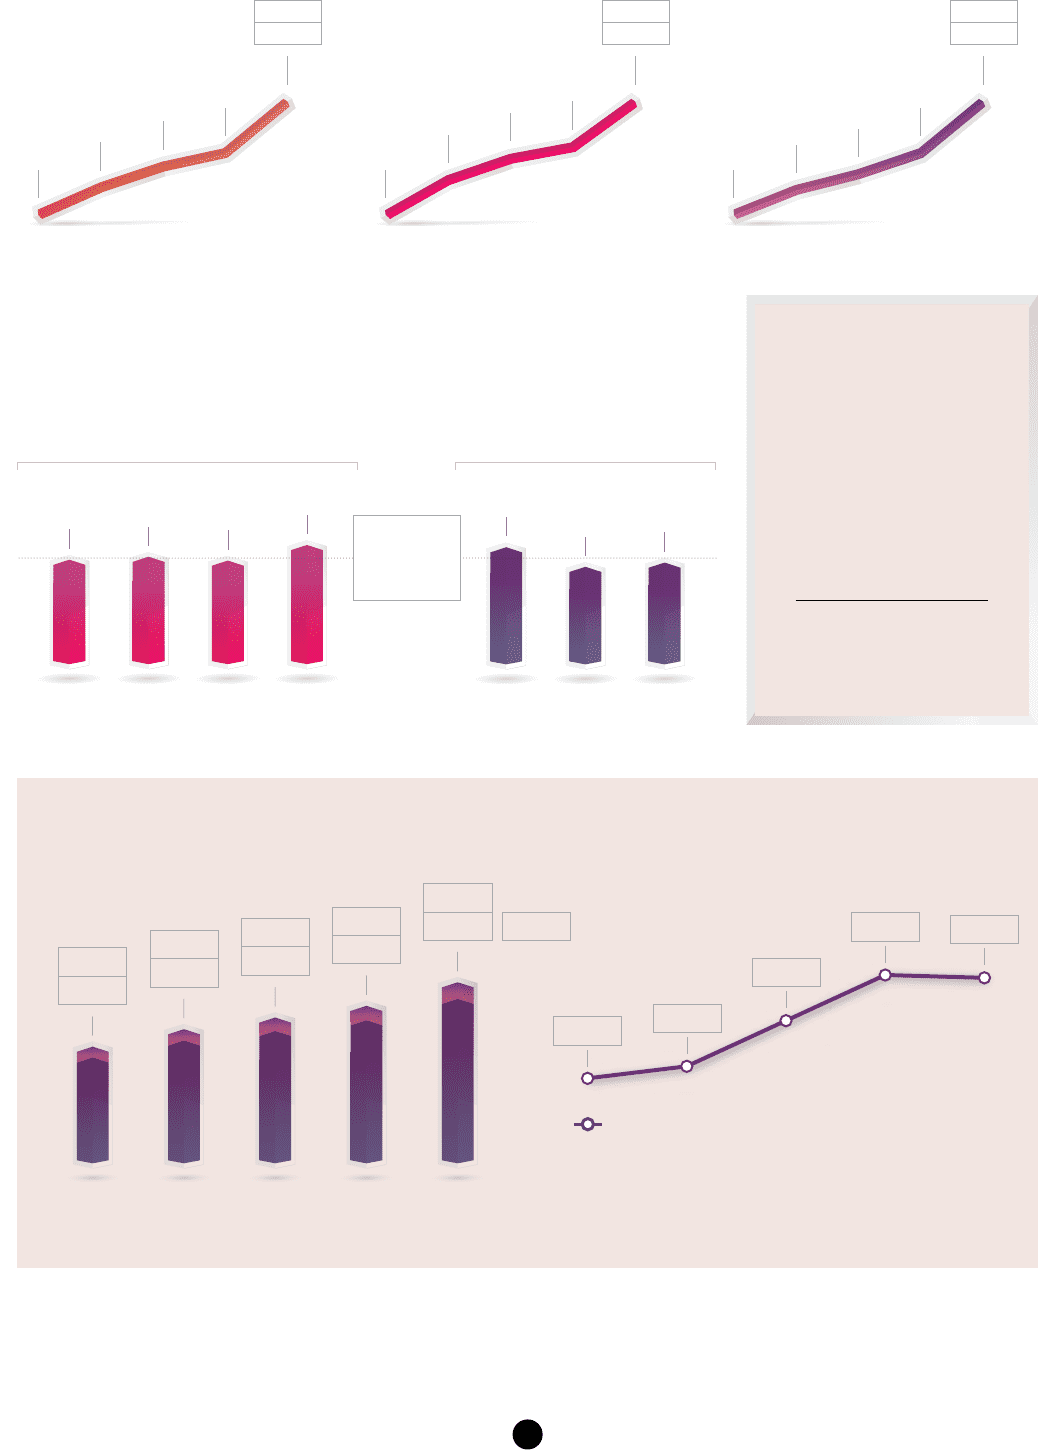
A new increase in earnings per share
OPERATING PROFIT
(in millions of euros)
EARNINGS PER SHARE (2)
(in euros)
NET PROFIT EXCLUDING
NON-RECURRING ITEMS
AFTER NON-CONTROLLING
INTERESTS (1)
(in millions of euros)
2011 2012 2013 2014 2015
E2.00
E2.20 E2.30
E2.53
E2.50
E2.75
E2.70
E2.97 E3.10 (4)
E3.41
(3)
Pay-out ratio as %
(6)
2011 2012 2013 2014 2015
46.3% 46.8%
48.7%
50.6% 50.2%
(5)
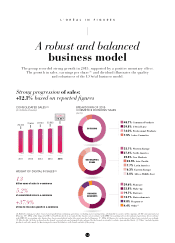
BY DIVISION
(as % of Division sales)
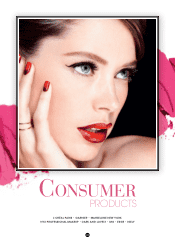
Consumer
Products
L’Oréal
Luxe
Professional
Products
Active
Cosmetics
20.1% 20.7% 20.0% 22.8%
BY ZONE
(as % of Zone sales)
Western
Europe
North
America
New
Markets
22.7% 19.7%
18.9%
E3.41 = Preferential dividend of +10% for shareholders who have
held shares in registered form for two years
(3)
20152011 2012 2013 2014
2,583
2,861
3,032 3,125
3,490
+11.7%
20152011 2012 2013 2014
4.32
4.73 4.99
5.34
6.18
+15.7%
20152011 2012 2013 2014
3,293
3,558
3,760 3,891
4,388
+12.8%
Cosmetics
Divisions’
profitability
20.5%
+14.8%
Balance of operating profitability A solid
balance sheet
Capital expenditure
4.6%
of sales
Shareholders’ Equity
70%
of total assets
Net cash surplus of
618
million euros
15