Loreal 2013 Annual Report Download - page 14
Download and view the complete annual report
Please find page 14 of the 2013 Loreal annual report below. You can navigate through the pages in the report by either clicking on the pages listed below, or by using the keyword search tool below to find specific information within the annual report.-
 1
1 -
2
-
3
-
 4
4 -
 5
5 -
 6
6 -
 7
7 -
 8
8 -
 9
9 -
 10
10 -
 11
11 -
 12
12 -
 13
13 -
 14
14 -
 15
15 -
 16
16 -
 17
17 -
 18
18 -
 19
19 -
 20
20 -
 21
21 -
 22
22 -
 23
23 -
 24
24 -
25
-
26
-
27
-
28
-
29
-
30
-
31
-
32
-
33
-
34
-
35
-
36
-
37
-
38
-
39
-
40
-
41
-
42
-
43
-
44
-
45
-
46
-
47
-
48
-
49
-
50
-
51
-
52
-
53
-
54
-
55
-
56
-
57
-
58
-
59
-
60
-
61
-
62
-
63
-
64
-
65
-
66
-
67
-
68
-
69
-
70
-
71
-
72
-
73
-
74
-
75
-
76
-
77
-
78
-
79
-
80
-
81
-
82
-
83
-
84
-
85
-
86
-
87
-
88
-
89
-
90
-
91
-
92
-
93
-
94
-
95
-
96
 |
 |
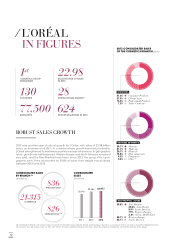
⁄ L’OR ÉA L
IN FIGURES
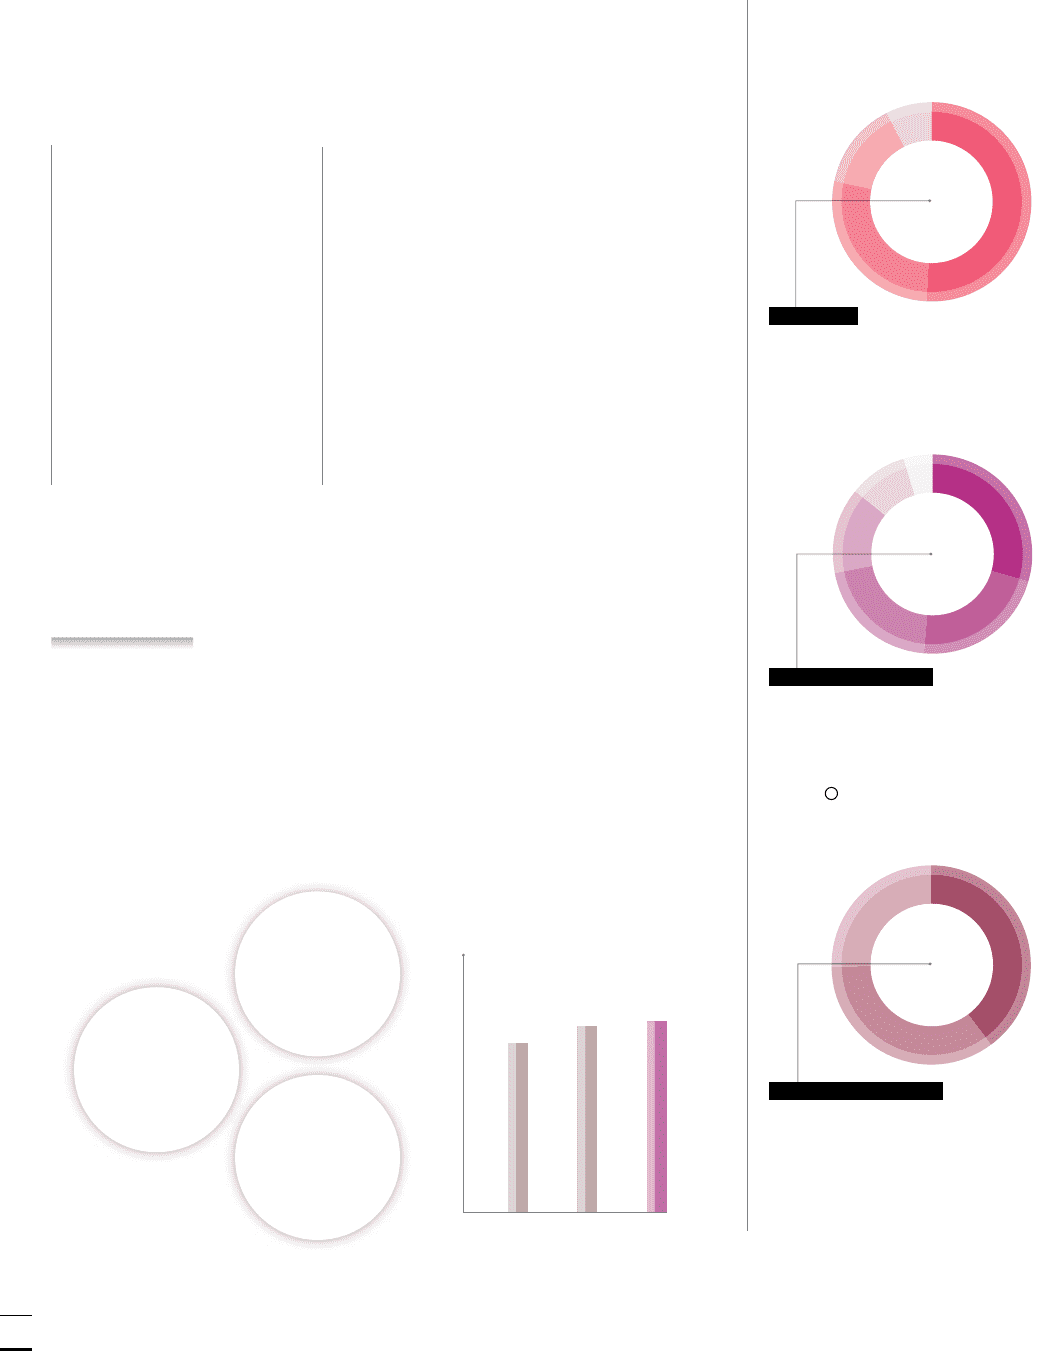
39.8% ● New Markets:
20.6% Asia-Pacific
8.9% Latin America
7.9% Eastern Europe
2.4% Africa, Middle East
35.1% ● Western Europe
25.1% ● North America
GEOGRAPHIC ZONES
29.7% ● Skincare
21.7% ● Make-up
20.7% ● Haircare
13.8% ● Hair colourants
9.5% ● Fragrances
4.6% ● Other
(5)
BUSINESS SEGMENTS
51.0% ● Consumer Products
27.5% ● L’Oréal Luxe
14.0% ● Professional Products
7.5% ● Active Cosmetics
DIVISIONS
2013 CONSOLIDATED SALES
OF THE COSMETICS BRANCH (as %)
(1) International brands with annual sales of more than 50 million euros. (2) Like-for-like. (3) The group’s business is composed of the cosmetics and dermatology branches,
and THE BODY SHOP. (4) Group share, i.e. 50%. (5) “Other” includes hygiene products and sales made by American distributors with brands outside of the group.
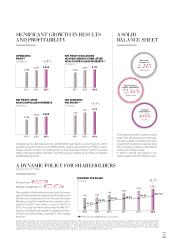
ROBUST SALES GROWTH
2013 was another year of robust growth for L’Oréal, with sales of 22.98 billion
euros, an increase of +5.0%(2). In a market whose growth was more moderate,
L’Oréal strengthened its worldwide positions across all divisions. In geographic
terms, growth was well-balanced: Western Europe and North America remained
very solid, and the New Markets have been, since 2012, the group’s No.1 geo-
graphic zone. They accounted for 39.8% of sales: their weight has doubled
between 2000 and 2013.
CONSOLIDATED SALES
BY BRANCH
(3)
(€ millions)
DERMATOLOGY
(4)
826
THE BODY SHOP
836
COSMETICS
21,315
1st
COSMETICS GROUP
WORLDWIDE
28
INTERNATIONAL BRANDS (1)
130
COUNTRIES
624
PATENTS REGISTERED IN 2013
77,500
EMPLOYEES
22.98
BILLION EUROS OF SALES
IN 2013
CONSOLIDATED
SALES
(€ millions)
22,977
2013
22,463
2012
20,343
2011
12