JVC 2012 Annual Report Download - page 3
Download and view the complete annual report
Please find page 3 of the 2012 JVC annual report below. You can navigate through the pages in the report by either clicking on the pages listed below, or by using the keyword search tool below to find specific information within the annual report.-
 1
1 -
 2
2 -
 3
3 -
 4
4 -
 5
5 -
 6
6 -
 7
7 -
 8
8 -
 9
9 -
 10
10 -
 11
11 -
 12
12 -
 13
13 -
 14
14 -
15
-
16
-
17
-
18
-
19
-
20
-
21
-
22
-
23
-
24
-
25
-
26
-
27
-
28
-
29
-
30
-
31
-
32
-
33
-
34
-
35
-
36
-
37
-
38
-
39
-
40
 |
 |

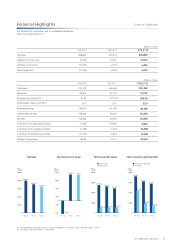
(Millions of yen)
FYE 3/ʼ10 FYE 3/ʼ11 FYE 3/12
Net Sales 398,663 352,672 320,869
Operating income (loss) (6,454) 12,957 12,813
Ordinary income (loss) (14,753) 7,579 6,420
Net income (loss) (27,796) (4,025) 6,032
(Millions of yen)
FYE 3/ʼ10 FYE 3/ʼ11 FYE 3/12
Total assets 274,752 260,664 241,762
Net assets 46,819 52,740 57,073
Net assets per share (Yen) 47.45 375.19※1399.76
Stockholdersʼ equity ratio (%)※216.7 20.0 22.9
Retained earnings (38,301) (41,305) 24,188
Interest-bearing debt 108,306 93,053 86,368
Net debt 64,804 28,081 20,808
Cash flows from operating activities 21,453 19,987 8,883
Cash flows from investing activities (3,158) 5,354 (6,498)
Cash flows from financing activities (27,120) (2,291) (1,523)
Number of employees 18,446 17,271 13,594
500,000
Millions
of yen
400,000
300,000
200,000
100,000
FYE 3/’10 FYE 3/’11
0
0
10,000
14,000
Millions
of yen
6,000
2,000
-2,000
-6,000
FYE 3/’12FYE 3/’10 FYE 3/’11
400,000
Millions
of yen
300,000
200,000
100,000
FYE 3/’10 FYE 3/’11
0
120,000
Millions
of yen
90,000
60,000
30,000
FYE 3/’10 FYE 3/’11
0
Net sales Operating income (loss) Total assets/Net assets Interest-bearing debt/Net debt
ota at
Nt at
ntrtarin t
Nt t
121
127
2772 20
1 270
FYE 3/’12
2172
707
100
0
0
201
FYE 3/’12
200
272
FYE 3/’12
20
※1. JVCKENWOOD conducted a 10-for-1 stock consolidation of its common shares, effective August 1, 2010.
※2. (Net assets – Minority interests) ÷ Total assets
1
JVC KENWOOD Corporation
Financial Highlights
JVC KENWOOD Corporation and Consolidated Subsidiaries
Fiscal Year ended March 31
Financial Highlights