Ingram Micro 2001 Annual Report Download - page 4
Download and view the complete annual report
Please find page 4 of the 2001 Ingram Micro annual report below. You can navigate through the pages in the report by either clicking on the pages listed below, or by using the keyword search tool below to find specific information within the annual report.-
 1
1 -
 2
2 -
 3
3 -
 4
4 -
 5
5 -
 6
6 -
 7
7 -
 8
8 -
 9
9 -
 10
10 -
 11
11 -
 12
12 -
 13
13 -
 14
14 -
 15
15 -
16
-
17
-
18
-
19
-
20
-
21
-
22
-
23
-
24
-
25
-
26
-
27
-
28
-
29
 |
 |

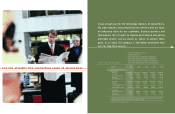
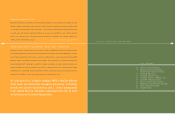
It’s strategically connecting vision to performance
The Greeks were first to theorize that the earth is round. Columbus
confirmed the theory in 1492 upon reaching America. And Magellan
proved it once and for all when his three-year voyage around the
world was completed in 1522. It took vision — vision combined with
courage — to embark upon a new direction that would rewrite the
rules and forever change the way we look at the world.
Ingram Micro has this kind of vision. In our own quest to determine what lies beyond the horizon, we discovered that our
world, the world of IT distribution, is not round. It is, in fact, a series of straight lines. Lines that connect us — to our
customers, vendors and shareowners. The line connecting vision to performance. As a result, we are rewriting the rules and
changing the way we look at our world.
I am pleased to report to you that, despite one of the worst demand environments to ever hit the IT industry, Ingram Micro
plotted a straight course and emerged a stronger company. We did what we needed to do. We reduced costs and held steady
on improved gross margins while we fortified our customer relationships. Through it all, our best-in-class balance sheet
continues to be strengthened, with a total debt-to-capitalization ratio that is the lowest in the IT distribution industry.
BALANCING THE BOTTOM LINE
The unprecedented business environment that challenged the IT industry at the end of
2000 continued to affect market conditions in 2001. Our net sales were $25.2 billion for
the year, down 18 percent. We delivered net income for the full year of $48.9 million or
$0.32 per diluted share, before reorganization costs, special items and losses for the
repurchase of debentures totaling $42.1 million. This compares to net income of $154.4
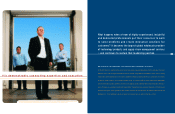
DEAR SHAREOWNERS:
Kent B. Foster
Chairman and CEO
million or $1.04 per diluted share in 2000, which excludes gains from the
sales of securities and repurchase of debentures totaling $71.7 million.
Again, we assumed leadership for the IT distribution industry to achieve long-term profitability. Building on last year’s success
to increase gross margins, we focused our efforts on reducing costs while balancing share growth with strong gross margins.
Step by step, we made visible improvements to our cost structure, reducing expenses by more than $36 million compared with
the fourth quarter of 2000. Beyond their size and scope, the reductions we made were thoughtful, targeted, and supported
by a process designed to maximize efficiencies with minimal business disruption. The steps we have taken were done with
our customers and vendors in mind, designed to improve levels of service and support.
Let me provide a few examples to illustrate my point.
We reorganized the U.S. sales and product management divisions, consolidated distribution and return centers, and refocused
the IT functions to support a more service-oriented business model. Nearly 6,500 customers were moved to the dedicated
sales teams we created, without increasing personnel or sacrificing customer relationships. The response from customers has
been overwhelmingly positive. We have consistently heard praise from our customers for the higher service levels. It’s clear
that we reached a new benchmark in our high quality customer service.
We also increased efficiencies in our distribution centers through state-of-the-art supply chain automation. This year, we
introduced next-generation technology in our U.S. distribution centers. Our new system, called IM-First, is wireless, paperless
and virtually eliminates the manual collection of data. Through automation we can increase utilization, allowing us to consolidate
facilities without reducing service levels. In fact, we rationalized our distribution networks in the United States, Europe and
Latin America, as we reduced the number of centers or replaced outdated centers with newer, more efficient facilities.
We are changing the rules of the IT distribution business, proving that operational efficiencies and high quality service can
go hand in hand.
DEMONSTRATING VALUE
We did not shy away from the slow economic environment — instead, we had the courage and discipline to pursue opportunities
for profitable growth. Our pricing strategy was surgical and smart, and it was complemented by increases in fee-based revenues
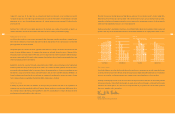
5
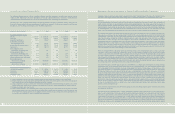
WORKING CAPITAL Q4’99 Q4’01 IMPROVEMENT %
INVENTORY $3,472 $1,624 $1,848 53%
INVENTORY TURNS 914 5
DSO (1) 36 37 (1)
DPO 52 41 (11)
TOTAL DEBT, INCLUDING $1,611 $680 $931 58%
OFF-BALANCE SHEET DEBT (1)
(1) Includes off-balance sheet debt associated with our accounts
receivable financing programs
DSO: Accounts Receivable Days of Sales Outstanding
DPO: Days of Accounts Payable Outstanding
$ MILLIONS