Ingram Micro 2001 Annual Report Download - page 19
Download and view the complete annual report
Please find page 19 of the 2001 Ingram Micro annual report below. You can navigate through the pages in the report by either clicking on the pages listed below, or by using the keyword search tool below to find specific information within the annual report.-
 1
1 -
2
-
3
-
4
-
5
-
6
-
7
-
8
-
 9
9 -
 10
10 -
 11
11 -
 12
12 -
 13
13 -
 14
14 -
 15
15 -
 16
16 -
 17
17 -
 18
18 -
 19
19 -
 20
20 -
 21
21 -
 22
22 -
 23
23 -
 24
24 -
 25
25 -
 26
26 -
 27
27 -
 28
28 -
 29
29
 |
 |

Notes to Consolidated Financial Statements
(Dollars in 000s, except per share data)
Note 1 - Organization and Basis of Presentation
Ingram Micro Inc. (“Ingram Micro”) is primarily engaged, directly and through its wholly- and majority-owned subsidiaries, in distribution
of information technology products and services worldwide. Ingram Micro operates in the United States, Europe, Canada, Latin America
and Asia-Pacific.
Note 2 - Significant Accounting Policies
Basis of Consolidation
The consolidated financial statements include the accounts of Ingram Micro and its subsidiaries (collectively referred to herein as the
“Company”). All significant intercompany accounts and transactions have been eliminated in consolidation.
Fiscal Year
The fiscal year of the Company is a 52- or 53-week period ending on the Saturday nearest to December 31. All references herein to “2001,”
“2000,” and “1999” represent the 52-week fiscal years ended December 29, 2001, December 30, 2000, and January 1, 2000, respectively.
Use of Estimates
Preparation of financial statements in conformity with generally accepted accounting principles requires management to make estimates
and assumptions that affect the reported amounts of assets and liabilities, and disclosure of contingent assets and liabilities at the
financial statement date, and reported amounts of revenue and expenses during the reporting period. Significant estimates primarily
relate to realizable value of accounts receivable; vendor programs; inventories; long-lived assets, goodwill, and intangible assets; income
taxes; and commitments and contingencies. Actual results could differ from these estimates.
Revenue Recognition
In December 1999, the Securities and Exchange Commission (the “SEC”) issued Staff Accounting Bulletin No. 101 (“SAB 101”). SAB 101
summarizes the SEC’s views in applying generally accepted accounting principles to revenue recognition. The adoption of SAB 101 had no
material impact on the Company’s financial position or results of operations.
Revenue on products shipped is recognized when the risks and rights of ownership are substantially passed to the customer. Service
revenues are recognized upon delivery of the services. Service revenues have represented less than 10% of total net sales for 2001, 2000
and 1999. The Company, under specific conditions, permits its customers to return or exchange products. The provision for estimated
sales returns is recorded concurrently with the recognition of revenue.
Vendor Programs
Funds received from vendors for price protection, product rebates, marketing and training, and promotion programs are generally
recorded, net of direct costs, as adjustments to product costs, revenue or selling, general and administrative expenses according to the
nature of the program.
The Company generated approximately 39% of its net sales in fiscal 2001, 42% in 2000, and 39% in 1999 from products purchased from
three vendors.
Warranties
The Company’s suppliers generally warrant the products distributed by the Company and allow returns of defective products, including
those that have been returned to the Company by its customers. The Company does not independently warrant the products it
distributes; however, the Company does warrant the following: (1) its services with regard to products that it configures for its customers,
and (2) products that it builds to order from components purchased from other sources. Provision for estimated warranty costs is
recorded at the time of sale and periodically adjusted to reflect actual experience. Warranty expense is not material to the Company’s
consolidated statement of income.
35
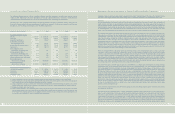
Ingram Micro Inc. Consolidated Statement of Cash Flows
(Dollars in 000s) Fiscal Year 2001 2000 1999
Cash flows from operating activities:
Net income $ 6,737 $ 226,173 $ 183,419
Adjustments to reconcile net income to
cash provided by operating activities:
Depreciation 94,017 86,471 74,70 1
Amortization of goodwill 20,963 22,039 22,900
Noncash charges for write-off of property and
equipment, software, and impairment of investment 21,504 - -
Noncash charges for interest and compensation 6,993 23,1 45 28,870
Deferred income taxes 7,553 50,757 22,524
Pre-tax gain on sale of available-for-sale securities - (1 1 1,458) (201,318)
Loss (gain) on repurchase of debentures (net of tax) 2,610 (2,420) (3,778)
Changes in operating assets and liabilities, net of
effects of acquisitions:
Changes in amounts sold under accounts
receivable programs (687,935) 647,600 162,588
Accounts receivable 643,836 (142,357) (256,854)
Inventories 1,292,429 556,222 (307,940)
Other current assets 45,01 1 53,850 (101,127)
Accounts payable (1,100,279) (614,398) 899,574
Accrued expenses (66,74 1) 43,453 62,877
Cash provided by operating activities 286,698 839,077 586,436
Cash flows from investing activities:
Purchase of property and equipment (86,438) (146,104) (135,260)
Proceeds from sale of property and equipment 20,289 16,400 10,433
Acquisitions, net of cash acquired (15,923) (4,620) (241,928)
Net proceeds from sale of available-for-sale securities - 119,228 230,109
Other 1 1,764 (4,385) (1,795)
Cash used by investing activities (70,308) (19,481) (138,441)
Cash flows from financing activities:
Repurchase of Redeemable Class B Common Stock (39) (89) (107)
Proceeds from exercise of stock options 19,912 10,397 7,404
Repurchase of debentures (224,977) (231,330) (50,321)
Net proceeds from issuance of senior subordinated notes 195,084 - -
Proceeds from (repayment of) debt (36,201) (156,232) 123,999
Net repayments under revolving credit facilities(32,109) (428,053) (508,250)
Cash used by financing activities (78,330) (805,307) (427,275)
Effect of exchange rate changes on cash (15,561) 8,1 1 9 10,750
Increase in cash 122,499 22,408 31,470
Cash, beginning of year 150,560 128,1 52 96,682
Cash, end of year $ 273,059 $ 150,560 $ 128,152
Supplemental disclosures of cash flow information:
Cash payments during the year:
Interest $ 47,246 $ 72,953 $ 72,343
Income taxes 43,858 40,438 96,682
Noncash investing activities during the year:
Assets acquired in exchange for liabilities assumed 157,700 - -
Equity incentive plan stock issuance 790 - 3,458
See accompanying notes to these consolidated financial statements.
34