Ingram Micro 2001 Annual Report Download - page 11
Download and view the complete annual report
Please find page 11 of the 2001 Ingram Micro annual report below. You can navigate through the pages in the report by either clicking on the pages listed below, or by using the keyword search tool below to find specific information within the annual report.-
 1
1 -
 2
2 -
 3
3 -
 4
4 -
 5
5 -
 6
6 -
 7
7 -
 8
8 -
 9
9 -
 10
10 -
 11
11 -
 12
12 -
 13
13 -
 14
14 -
 15
15 -
 16
16 -
 17
17 -
 18
18 -
 19
19 -
 20
20 -
 21
21 -
 22
22 -
23
-
24
-
25
-
26
-
27
-
28
-
29
 |
 |

Management’s Discussion and Analysis of Financial Condition and Results of Operations
In evaluating our business, readers should carefully consider the important factors discussed in “Cautionary Statements for the Purpose of the ’Safe Harbor‘ Provisions
of the Private Securities Litigation Reform Act of 1995” included in Exhibit 99.01 to our Annual Report on Form 10-K for the fiscal year ended December 29, 2001.
Overview
We are the leading distributor of information technology (“IT”) products and services worldwide based on revenues. From 1997 to 2000, our net sales grew
from $16.6 billion to $30.7 billion. The growth during this period reflected the substantial expansion of our existing operations from the integration of
numerous acquisitions worldwide, growth in the IT products and services distribution industry in general, the addition of new product categories and
suppliers, the addition of new customers, and increased sales to the existing customer base. In 2001, our net sales declined to $25.2 billion. This reduction
was primarily attributable to the general decline in demand for technology products and services throughout the world, which began in the fourth
quarter of 2000. This sluggish demand for technology products and services is expected to continue, and may worsen, over the near term.
The IT distribution industry in which we operate is characterized by narrow gross profit as a percentage of net sales (“gross margin”) and narrow income
from operations as a percentage of net sales (“operating margin”). From 1997 to 1999, our gross margin declined to 4.8% in 1999 from 6.5% in 1997 with
sequential declines in gross margin each of those years. Initially, the margin decline was caused by intense price competition. Later however, changes in
vendor terms and conditions, including, but not limited to, significant reductions in vendor rebates and incentives, tighter restrictions on our ability to
return inventory to vendors, and reduced time periods qualifying for price protection, exacerbated the decline and constrained gross margin
improvements. We expect these competitive pricing pressures and restrictive vendor terms and conditions to continue in the foreseeable future. We have
implemented and continue to refine changes to our pricing strategies, inventory management processes, and administration of vendor subsidized
programs. In addition, we continue to monitor and change on a periodic basis certain of the terms and conditions offered to our customers to reflect those
being imposed by our vendors. We recorded sequential improvements in gross margin in each of the past two years, reaching 5.1% in fiscal year 2000 and
5.3% in 2001 compared to 4.8% realized in 1999, primarily as a result of these initiatives.
We have also continually instituted operational and expense controls that reduced selling, general, and administrative expenses, or SG&A, as a percentage
of net sales to 3.9% in 2000 from 4.2% in 1997, reflecting more effective cost control measures, streamlined processes, and the benefit of greater
economies of scale. However, for fiscal year 2001, SG&A as a percentage of net sales increased to 4.7% due to the significant decline in our net revenues.
As a result, we initiated a broad-based reorganization plan in 2001 to streamline operations and reorganize resources to increase flexibility, improve
service and generate cost savings and operational efficiencies. This reorganization plan includes restructuring of several functions, consolidation of facilities,
and reductions of headcount. Although we expect these actions to result in future savings, if any future reductions in gross margins were to occur, or if
net revenues continue to decline, we may take additional restructuring actions, which could result in significant additional charges. In addition, there can
be no assurance that we will be able to implement such actions or reduce SG&A commensurately.
In December 1998, we purchased 2,972,400 shares of common stock of SOFTBANK Corp., or Softbank, Japan’s largest distributor of software, peripherals
and networking products, for approximately $50.3 million. During December 1999, we sold approximately 35% of our original investment in Softbank common
stock for approximately $230.1 million, resulting in a pre-tax gain of approximately $201.3 million, net of related expenses. In January 2000, we sold an
additional approximately 15% of our original holdings in Softbank common stock for approximately $119.2 million resulting in a pre-tax gain of approximately
$111.5 million, net of expenses. We used the proceeds from this sale to reduce existing indebtedness. The realized gains, net of expenses, associated with
the sales of Softbank common stock in January 2000 and December 1999 totaled $69.3 million and $125.2 million, respectively, net of deferred taxes of
$42.1 million and $76.1 million, respectively (see Notes 2 and 8 to consolidated financial statements). The Softbank common stock was sold in the public
market by one of our foreign subsidiaries, which is located in a low-tax jurisdiction. At the time of the sale, we concluded that U.S. taxes were not currently
payable on the gains based on our internal assessment and opinions received from our advisors. However, in situations involving uncertainties in the
interpretation of complex tax regulations by various taxing authorities, we provide for deferred tax liabilities unless we consider it probable that taxes will
not be due. The level of opinions received from our advisors and our internal assessment did not allow us to reach that conclusion on this matter. Although
we review our assessments in these matters on a regular basis, we cannot currently determine when this matter will be finally resolved with the taxing
authorities or if taxes will ultimately be paid.
Our federal income tax returns through fiscal year 1996 have been audited and closed. The U.S. IRS has initiated its audit of our federal income tax returns
for fiscal years 1997 through 1999.
The IT products and services distribution business is working capital intensive. Our business requires significant levels of working capital primarily to
finance accounts receivable. We have relied heavily on debt and accounts receivable financing programs for our working capital needs. In March 2000, we
entered into a revolving five-year accounts receivable securitization program in the U.S., which provides for the issuance of up to $700 million in
commercial paper. This program adds to our existing accounts receivable facilities, which provide additional financing capacity of approximately $273
million. As of December 29, 2001, approximately $222.3 million of accounts receivable were sold to and held by third parties under these programs. On
August 16, 2001, we sold $200 million of 9.875% senior subordinated notes due 2008 at an issue price of 99.382%, resulting in cash proceeds of approximately
$195.1 million, net of issuance costs of approximately $3.7 million. On August 16, 2001, we also entered into interest rate swap agreements with two financial
19
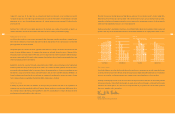
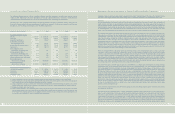
Selected Consolidated Financial Data
The following table presents our selected consolidated financial data. The information set forth below should be read in
conjunction with “Management’s Discussion and Analysis of Financial Condition and Results of Operations” and the historical
consolidated financial statements and notes thereto, included elsewhere in this Annual Report to Shareowners.
Our fiscal year is a 52- or 53-week period ending on the Saturday nearest to December 31. References below to 1997, 1998, 1999,
2000 and 2001 represent the fiscal years ended January 3, 1998 (53 weeks), January 2, 1999 (52 weeks), January 1, 2000 (52 weeks),
December 30, 2000 (52 weeks), and December 29, 2001 (52 weeks), respectively.
(Dollars in 000s, except per share data) 2001 2000 1999 1998 1997
Selected Operating Information
Net sales$ 25,186,933 $ 30,715,14 9 $ 28,068,642 $ 22,034,038 $ 16,581,539
Gross profit 1,329,899 1,556,298 1,336,163 1,391,168 1,085,689
Income from operations (1) 92,930 353,437200,004 486,605 376,579
Income before income taxes
and extraordinary item (2) 15,935 362,509 290,493 406,860 326,489
Income before extraordinary item (3) 9,347 223,753 1 79,641 245,1 75 193,640
Net income (3) 6,737 226,1 73 183,419 245,1 75 193,640
Basic earnings per share –
income before extraordinary item 0.06 1.54 1.25 1.76 1.43
Diluted earnings per share –
income before extraordinary item 0.06 1.5 1 1.21 1.64 1.32
Basic earnings per share – net income 0.05 1.55 1.28 1.76 1.43
Diluted earnings per share – net income 0.04 1.52 1.24 1.64 1.32
Basic weighted average
common shares outstanding 147,511,408 145,213,882 143,404,207 139,263,810 135,764,053
Diluted weighted average
common shares outstanding 150,047,807 148,640,991 147,784,712 149,537,870 146,307,532
Selected Balance Sheet Information (4)
Cash and cash equivalents $ 273,059 $ 150,560 $ 128,152 $ 96,682 $ 92,212
Total assets 5,302,007 6,608,982 8,271,927 6,733,404 4,932,1 5 1
Total debt (5) 458,107 545,618 1,348,1351,720,4561,141,131
Stockholders’ equity 1,867,298 1,874,392 1,966,845 1,399,257 1,038,206
(1) Includes reorganization costs and special items of $41,411 and $22,893, respectively, in 2001 and reorganization costs of $20,305 in 1999.
(2) Includes reorganization costs and special items of $41,411 and $22,893, respectively, in 2001 and reorganization costs of $20,305 in 1999, and gains on
sales of available-for-sale securities of $111,458 and $201,318 in 2000 and 1999, respectively.
(3) Includes reorganization costs and special items, net of tax benefits, of $25,447 and $14,067, respectively, in 2001 and reorganization costs, net of tax
benefits, of $12,789 in 1999, and gains on sales of available-for-sale securities, net of income taxes, of $69,327 and $125,220 in 2000 and 1999, respectively.
(4) All balance sheet data are given at end of period.
(5) Includes convertible debentures, senior subordinated notes, revolving credit facilities and other long-term debt and current maturities of long-term
debt, but excludes off-balance sheet debt of $222,253, $910,188, $262,588, $100,000 and $160,000, respectively, at the end of fiscal year 2001, 2000,
1999, 1998 and 1997, which amounts represent all of the undivided interests in transferred accounts receivable sold to and held by third parties as of
the respective balance sheet dates (see Note 5 to consolidated financial statements).
18