Ingram Micro 2001 Annual Report Download - page 3
Download and view the complete annual report
Please find page 3 of the 2001 Ingram Micro annual report below. You can navigate through the pages in the report by either clicking on the pages listed below, or by using the keyword search tool below to find specific information within the annual report.-
 1
1 -
 2
2 -
 3
3 -
 4
4 -
 5
5 -
 6
6 -
 7
7 -
 8
8 -
 9
9 -
 10
10 -
 11
11 -
 12
12 -
 13
13 -
 14
14 -
15
-
16
-
17
-
18
-
19
-
20
-
21
-
22
-
23
-
24
-
25
-
26
-
27
-
28
-
29
 |
 |

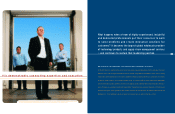
It’s the straight line connecting value to shareowner
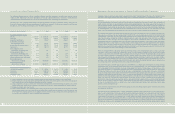
Financial Highlights
FISCAL YEAR 2001 2000 1999 1998 1997
($ in thousands, except per share data)
Reported Results
Net Sales $25,186,933 $30,715,149 $28,068,642 $22,034,038 $16,581,539
Gross Profit 1,329,899 1,556,298 1,336,163 1,391,168 1,085,689
Income from Operations 92,930 353,437 200,004 486,605 376,579
Net Income 6,737 226,173 183,419 245,175 193,640
Diluted Earnings Per Share 0.04 1.52 1.24 1.64 1.32
Total Assets $5,302,007 $6,608,982 $8,27 1,927 $6,733,404 $4,932, 1 5 1
Total Debt 458,107 545,6 18 1,348,135 1,720,456 1 ,1 4 1, 1 3 1
Total Debt, including off-balance
sheet financing (1) 680,360 1,455,806 1,610,723 1,820,456 1,301, 1 3 1
Total Stockholders’ Equity 1,867,298 1,874,392 1,966,845 1,399,257 1,038,206
Pro Forma Results
Income from Operations (2) $157,234$353,437$220,309$486,605 $376,579
Net Income (3) 48,861 154,426 67,210 245,175 193,640
Diluted Earnings Per Share (3) 0.32 1.04 0.45 1.64 1.32
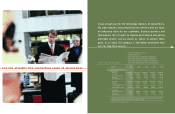
It was a tough year for the technology industry. At Ingram Micro,
the slow economic environment did not interfere with our focus
on enhancing value for our customers, business partners and
shareowners. We set goals to improve performance and pursue
profitable growth, and we stayed on course to achieve these
goals. As a result, the company is now better positioned than
ever for long-term success.
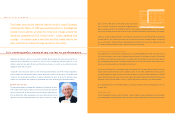
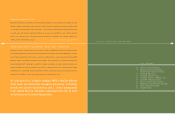
•Increased Gross Margins to 5.28 Percent
•Strengthened Balance Sheet
•Reduced Selling, General and Administrative (SG&A) Expenses
by more than $36 Million in Q4 2001 Compared with Q4 2000
•Reduced Inventory 44 Percent — $1.3 Billion — with Higher Turns
•Lowest Debt-to-Capitalization Ratio in the IT Distribution Industry
3
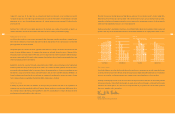
(1) Includes off-balance sheet debt of $222,253, $910,188, $262,588, $100,000, and $160,000, as of fiscal year end 2001, 2000, 1999, 1998, and 1997, respectively, which
amounts represent all of the undivided interests in transferred accounts receivables, sold to and held by third parties as of the respective balance sheet dates.
(2) Excludes reorganization costs and special items of $64,304 and $20,305 in 2001 and 1999, respectively.
(3) Excludes net after-tax charges (gains) from reorganization costs and special items, sales of available-for-sale securities, and extraordinary items of $42,124, ($71,747)
and ($116,209) in 2001, 2000, and 1999, respectively.