Ingram Micro 2001 Annual Report Download - page 14
Download and view the complete annual report
Please find page 14 of the 2001 Ingram Micro annual report below. You can navigate through the pages in the report by either clicking on the pages listed below, or by using the keyword search tool below to find specific information within the annual report.-
 1
1 -
2
-
3
-
 4
4 -
 5
5 -
 6
6 -
 7
7 -
 8
8 -
 9
9 -
 10
10 -
 11
11 -
 12
12 -
 13
13 -
 14
14 -
 15
15 -
 16
16 -
 17
17 -
 18
18 -
 19
19 -
 20
20 -
 21
21 -
 22
22 -
 23
23 -
 24
24 -
25
-
26
-
27
-
28
-
29
 |
 |

Management’s Discussion and Analysis (continued)
Quarterly Data; Seasonality
Our quarterly operating results have fluctuated significantly in the past and will likely continue to do so in the future as a result of:
•seasonal variations in the demand for our products and services such as demand in Europe during the summer months, increased Canadian
government purchasing in the first quarter, and worldwide pre-holiday stocking in the retail channel during the September-to-November period;
•competitive conditions in our industry, which may impact the prices charged by our suppliers and/or competitors and the prices we charge our customers;
•variations in our levels of excess inventory and doubtful accounts, and changes in the terms of vendor-sponsored programs such as
price protection and return rights;
•changes in the level of our operating expenses;
•the impact of acquisitions we may make;
•the impact of and possible disruption caused by reorganization efforts;
•the introduction by us or our competitors of new products and services offering improved features and functionality;
•the loss or consolidation of one or more of our significant suppliers or customers;
•product supply constraints;
•interest rate fluctuations, which may increase our borrowing costs, and may influence the willingness of customers and end-users to
purchase products and services;
•currency fluctuations in countries in which we operate; and
•general economic conditions.
Given the general slowdown in the global economy and specifically the demand for IT products and services, these historical variations
may not be indicative of future trends in the near term. Our narrow operating margins may magnify the impact of the foregoing factors
on our operating results.
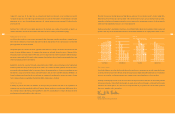
The following table sets forth certain unaudited quarterly historical financial data for each of the eight quarters in the period ended December 29,
2001. This unaudited quarterly information has been prepared on the same basis as the annual information presented elsewhere herein and, in our
opinion, includes all adjustments (consisting only of normal recurring adjustments) necessary for a fair presentation of the selected quarterly
information. This information should be read in conjunction with the consolidated financial statements and notes thereto included elsewhere in
this Annual Report to Shareowners. The operating results for any quarter shown are not necessarily indicative of results for any future period.
Income Diluted
Income (Loss) Earnings
Income (Loss) Before (Loss) Per Diluted
(Loss) Before Extra- Net Share Before Earnings
Net Gross From Income ordinary Income Extraordinary (Loss)
(in millions, except per share data) Sales Profit Operations Taxes Item (Loss) Item Per Share
Fiscal Year Ended December 29, 2001
Thirteen Weeks Ended (1) (2):
March 31, 2001 $ 7,193.5 $ 384.2 $ 70.5 $ 43.0 $ 26.4 $ 26.4 $ 0.18 $ 0.18
June 30, 2001 6,017.3 315.6 4.8 (14.7) (9.4) (12.0) (0.06) (0.08)
September 29, 2001 5,833.4 307.6 (5.7) (22.1) (13.3) (13.3) (0.09) (0.09)
December 29, 2001 6,142.7 322.5 23.3 9.7 5.6 5.6 0.04 0.04
Fiscal Year Ended December 30, 2000
Thirteen Weeks Ended (3):
April 1, 2000 $ 7,796.3 $ 366.2 $ 70.5 $ 152.0 $ 94.0 $ 96.1 $ 0.64 $ 0.65
July 1, 2000 7,295.0 361.5 76.4 53.5 33.1 33.3 0.22 0.22
September 30, 2000 7,558.7 387.9 87.2 62.9 38.8 38.9 0.26 0.26
December 30, 2000 8,065.1 440.7 119.3 94.1 57.9 57.9 0.39 0.39
(1) Reflects charges related to reorganization plans initiated to streamline operations and reorganize resources. Quarterly charges in 2001 were recorded
as follows: second quarter, $19.1 million; third quarter, $11.7 million; fourth quarter, $10.6 million.
(2) Reflects special items of $22.9 million in 2001 for the write-off of capitalized software ($10.2 million) and charges to reserve fully for outstanding
insurance claims with an insolvent insurer ($9.2 million) in the third quarter, and an impairment charge on an investment in an internet-related company
($3.5 million) in the fourth quarter.
(3) For the quarter ended April 1, 2000, income before income taxes included a pre-tax gain of approximately $111.5 million, net of related costs, realized
from the sale of Softbank common stock.
25
Management’s Discussion and Analysis (continued)
Gross margin increased to 5.1% in 2000 from 4.8% in 1999. The improvement in the gross margin was primarily due to pricing
policy changes we initiated during the second quarter of 2000 to more appropriately reflect the value and related costs of services we
provide to our customers, partially offset by the impact of changes in vendor terms and conditions including, but not limited to,
significant reductions in vendor rebates and incentives, tighter restrictions on our ability to return inventory to vendors, and reduced
time periods qualifying for price protection. We have implemented and continue to refine changes to our pricing strategies, inventory
management processes, and administration of vendor subsidized programs. In addition, we continue to change certain of the terms and
conditions offered to our customers to reflect those being imposed by our vendors.
Total SG&A expenses increased 7.8% to $1.2 billion in 2000 from $1.1 billion in 1999, but decreased as a percentage of net sales to 3.9% in
2000 from 4.0% in 1999. The increase in SG&A spending was attributable to increased expenses required to support the growth of our
business. Expenses related to expansion consist of incremental personnel and support costs, lease expenses related to new
operating facilities, and the expenses associated with the development and maintenance of information systems. The overall decrease in
SG&A expenses as a percentage of net sales is attributable to economies of scale from greater sales volume, and continued cost-control
measures. As noted above, demand for IT products and services in the U.S. has recently softened, which may lead to tempered and/or
negative sales growth in the U.S. for the next several quarters and a resulting increase in SG&A expenses as a percentage of net sales in
the near term. We continue to pursue and implement process improvements and organizational changes to create sustainable cost reductions
without sacrificing customer service over the long-term.
In 1999, we recorded a charge of $20.3 million related to reorganization efforts primarily in our U.S. and European operations. We did not
incur any reorganization charges in 2000.
Income from operations, excluding reorganization costs, increased as a percentage of net sales to 1.2% in 2000 from 0.8% in 1999. The
increase in our income from operations, excluding reorganization costs, as a percentage of net sales is primarily due to the increase in
gross margin as described above. Our U.S. income from operations, excluding reorganization costs, as a percentage of net sales increased
to 1.5% in 2000 from 0.9% in 1999, primarily as a result of gross margin improvements. Our European income from operations, excluding
reorganization costs, as a percentage of net sales increased to 0.7% in 2000 compared to 0.3% in 1999 also as a result of gross margin
improvements. Our Other International income from operations, excluding reorganization costs, as a percentage of net sales decreased
to 0.5% in 2000 from 1.0% in 1999. The decrease in income from operations as a percentage of net sales for our Other International
was primarily related to our Asia-Pacific operations, which experienced a loss from operations as we continue to invest in infrastructure
and refine our business processes in this developing market.
Other expense (income) consisted primarily of interest, foreign currency exchange losses, gains on sales of available-for-sale securities,
and losses on sales of receivables under our accounts receivable facilities. In 2000, we recorded net other income of $9.1 million,
compared to $90.5 million in 1999. The decrease in other income is primarily attributable to the lower gain realized on the sale of Softbank
common stock in 2000 compared to 1999. In December 1999, we sold approximately 35% of our original investment in Softbank common
stock for a pre-tax gain of approximately $201.3 million, net of related costs. In January 2000, we sold an additional approximately 15%
of our original holdings in Softbank common stock for a pre-tax gain of approximately $111.5 million, net of related costs. Excluding the
gains realized on the sales of Softbank common stock, our net other expense was $102.4 million in 2000 compared to $110.8 million in
1999. The decrease in net other expense was related to reduced borrowing costs, due to the decrease in the average borrowings
outstanding in 2000 compared to 1999 resulting from improved working capital management, the use of proceeds received from the
sale of Softbank common stock in December 1999 and January 2000 to reduce existing indebtedness, partially offset by an increase in
interest rates for the same period.
Our provision for income taxes increased 25.2% to $138.8 million in 2000 from $110.9 million in 1999, reflecting the 24.8% increase in our
income before income taxes and extraordinary item. Our effective tax rate remained relatively consistent at 38.3% in 2000 compared to
38.2% in 1999.
In 2000 and 1999, we repurchased convertible debentures with a total carrying value of $235.2 million and $56.5 million, respectively, as of
their repurchase dates for approximately $231.3 million and $50.3 million in cash, respectively. Our convertible debenture repurchases
resulted in an extraordinary gain of $2.4 million and $3.8 million in 2000 and 1999, respectively, net of $1.5 million and $2.4 million in
income taxes, respectively.
24