Hyundai 2007 Annual Report Download - page 98
Download and view the complete annual report
Please find page 98 of the 2007 Hyundai annual report below. You can navigate through the pages in the report by either clicking on the pages listed below, or by using the keyword search tool below to find specific information within the annual report.-
 1
1 -
2
-
3
-
4
-
5
-
6
-
7
-
8
-
9
-
10
-
11
-
12
-
13
-
14
-
15
-
16
-
17
-
18
-
19
-
20
-
21
-
22
-
23
-
24
-
25
-
26
-
27
-
28
-
29
-
30
-
31
-
32
-
33
-
34
-
35
-
36
-
37
-
38
-
39
-
40
-
41
-
42
-
43
-
44
-
45
-
46
-
47
-
48
-
49
-
50
-
51
-
52
-
53
-
54
-
55
-
56
-
57
-
58
-
59
-
60
-
61
-
62
-
63
-
64
-
65
-
66
-
67
-
68
-
69
-
70
-
71
-
72
-
73
-
74
-
75
-
76
-
77
-
78
-
79
-
80
-
81
-
82
-
83
-
84
-
85
-
86
-
87
-
 88
88 -
 89
89 -
 90
90 -
 91
91 -
 92
92 -
 93
93 -
 94
94 -
 95
95 -
 96
96 -
 97
97 -
 98
98 -
 99
99 -
 100
100 -
 101
101 -
 102
102 -
 103
103 -
 104
104 -
 105
105 -
 106
106 -
 107
107 -
 108
108 -
109
-
110
-
111
-
112
-
113
-
114
-
115
-
116
-
117
-
118
-
119
-
120
-
121
-
122
-
123
-
124
 |
 |

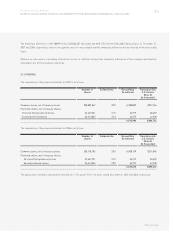
96 HYUNDAI MOTOR COMPANY
NOTES TO CONSOLIDATED FINANCIAL STATEMENTS FOR THE YEARS ENDED DECEMBER 31, 2007 AND 2006
Translation into
U.S. Dollars (Note 2)
(In thousands)
Korean Won
(In millions)
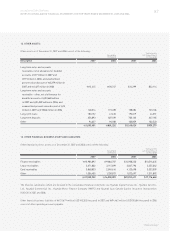
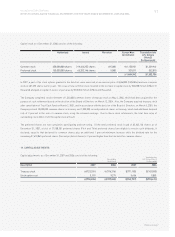
Company’s Company’s Company’s Company’s Company’s Company’s Company’s Company’s
income expenses income expenses income expenses income expenses
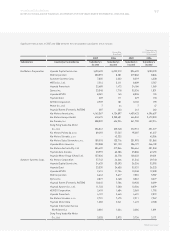
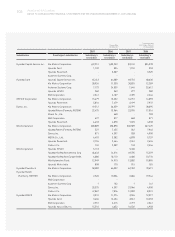
Kia Motors Corporation 870,101 423,335 623,330 651,530 $927,415 $451,220 $664,389 $694,447
Dymos Inc. 1,020 512,921 3,888 453,225 1,087 546,708 4,144 483,079
Hyundai Capital
Service Inc. 518,536 41,708 475,404 46,701 552,692 44,455 506,719 49,777
WIA Corporation 207,880 264,036 145,944 253,820 221,573 281,428 155,557 270,539
KEFICO Corporation 921 323,267 93 293,153 982 344,561 99 312,463
Hyundai HYSCO 4,020 240,511 1,846 171,530 4,285 256,354 1,968 182,829
Hyundai Powertech 26,841 207,611 18,317 150,671 28,609 221,287 19,524 160,596
Autoever Systems Corp. 502 165,231 172 154,967 535 176,115 183 165,175
Hyundai Autonet Co., Ltd. 839 101,251 230 142,653 894 107,920 245 152,050
2007 2006 2007 2006
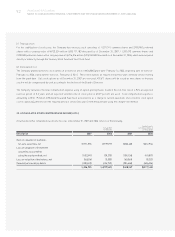
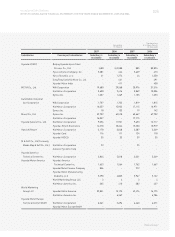
24. ELIMINATION OF UNREALIZED PROFITS AND LOSSES:
Unrealized profits and losses resulting from sales among consolidated subsidiaries are calculated based on the average gross margin rate
of selling companies and are eliminated in the consolidated financial statements.
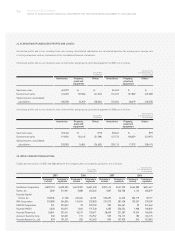
Unrealized profits and losses related to sales of inventories and property, plant and equipment in 2007 are as follows:
Korean Won
(In millions)
Translation into
U.S. Dollars (Note 2)
(In thousands)
Inventories Property, Others Inventories Property, Others
plant and plant and
equipment equipment
Upstream sales 3,999 -- $4,262 $ - $ -
Downstream sales 145,202 129,366 (41,074) 154,767 137,887 (43,780)
Sales between consolidated
subsidiaries 180,598 26,907 (38,044) 192,494 28,679 (40,550)
Unrealized profits and losses related to sales of inventories and property, plant and equipment in 2006 are as follows:
Korean Won
(In millions)
Translation into
U.S. Dollars (Note 2)
(In thousands)
Inventories Property, Others Inventories Property, Others
plant and plant and
equipment equipment
Upstream sales 3,440 -93 $3,667 $ - $99
Downstream sales 119,876 120,145 (51,598) 127,772 128,059 (54,997)
Sales between consolidated
subsidiaries 220,585 16,861 (26,655) 235,115 17,972 (28,411)
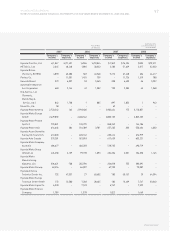
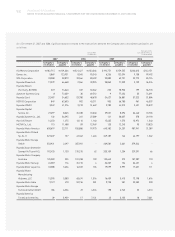
25. INTER-COMPANY TRANSACTIONS:
Significant transactions in 2007 and 2006 between the Company and consolidated subsidiaries are as follows: