Hyundai 2007 Annual Report Download - page 90
Download and view the complete annual report
Please find page 90 of the 2007 Hyundai annual report below. You can navigate through the pages in the report by either clicking on the pages listed below, or by using the keyword search tool below to find specific information within the annual report.-
 1
1 -
2
-
3
-
4
-
5
-
6
-
7
-
8
-
9
-
10
-
11
-
12
-
13
-
14
-
15
-
16
-
17
-
18
-
19
-
20
-
21
-
22
-
23
-
24
-
25
-
26
-
27
-
28
-
29
-
30
-
31
-
32
-
33
-
34
-
35
-
36
-
37
-
38
-
39
-
40
-
41
-
42
-
43
-
44
-
45
-
46
-
47
-
48
-
49
-
50
-
51
-
52
-
53
-
54
-
55
-
56
-
57
-
58
-
59
-
60
-
61
-
62
-
63
-
64
-
65
-
66
-
67
-
68
-
69
-
70
-
71
-
72
-
73
-
74
-
75
-
76
-
77
-
78
-
79
-
 80
80 -
 81
81 -
 82
82 -
 83
83 -
 84
84 -
 85
85 -
 86
86 -
 87
87 -
 88
88 -
 89
89 -
 90
90 -
 91
91 -
 92
92 -
 93
93 -
 94
94 -
 95
95 -
 96
96 -
 97
97 -
 98
98 -
 99
99 -
 100
100 -
101
-
102
-
103
-
104
-
105
-
106
-
107
-
108
-
109
-
110
-
111
-
112
-
113
-
114
-
115
-
116
-
117
-
118
-
119
-
120
-
121
-
122
-
123
-
124
 |
 |

88 HYUNDAI MOTOR COMPANY
NOTES TO CONSOLIDATED FINANCIAL STATEMENTS FOR THE YEARS ENDED DECEMBER 31, 2007 AND 2006
Korean Won
(In millions)
Annual
interest rate (%)
Translation into
U.S. Dollars (Note 2)
(In thousands)
Description 2007 2007 2006 2007 2006
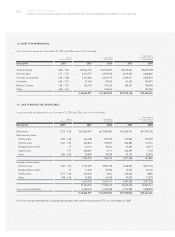
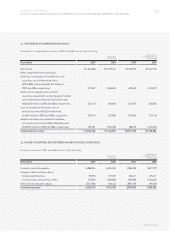
Trade financing 6.00 ~ 7.00 5,266,742 5,103,337 $5,613,667 $5,439,498
General loans 4.71 ~ 7.70 6,210,577 2,879,230 6,619,673 3,068,887
Discount of trade bills 4.38 ~ 7.08 4,155,580 2,674,219 4,429,311 2,850,372
Overdrafts 6.40 ~ 7.10 57,440 97,549 61,224 103,975
Banker’s Usance 1.04 ~ 7.32 736,732 741,643 785,261 790,496
Other 4.60 ~ 4.65 - 143,344 - 152,786
16,427,071 11,639,322 $17,509,136 $12,406,014
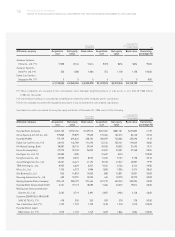
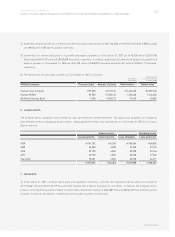
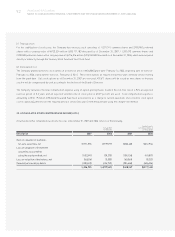
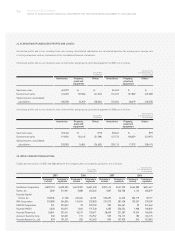
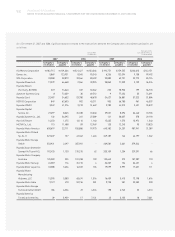
14. SHORT-TERM BORROWINGS:
Short-term borrowings as of December 31, 2007 and 2006 consist of the following:
Korean Won
(In millions)
Annual
interest rate (%)
Translation into
U.S. Dollars (Note 2)
(In thousands)
Description 2007 2007 2006 2007 2006
Debentures 3.73 ~ 9.20 15,605,994 13,306,584 $16,633,974 $14,183,100
Won currency loans:
Facility loans 3.00 ~ 7.48 446,438 205,705 475,845 219,255
General loans 4.55 ~ 7.55 266,810 109,537 284,385 116,752
Reorganization claims (*) 23,112 46,044 24,634 49,077
Capital lease 7.77 248,059 6,711 264,399 7,153
Other 1.00 ~ 3.50 20,804 28,758 22,175 30,652
1,005,223 396,755 1,071,438 422,889
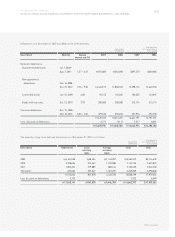
Foreign currency loans:
General loans 3.25 ~ 7.24 4,192,379 3,581,798 4,468,534 3,817,734
Reorganization claims (*) 11,270 22,296 12,012 23,765
Facility loans 5.15 ~ 7.64 422,249 3,644 450,063 3,884
Other 3ML+1.20 53,805 67,433 57,349 71,875
4,679,703 3,675,171 4,987,958 3,917,258
21,290,920 17,378,510 22,693,370 18,523,247
Less: current maturities 4,428,143 4,595,588 4,719,828 4,898,303
16,862,777 12,782,922 $17,973,542 $13,624,944
(*) 3 year non-guaranteed bond circulating earning rate at the end of every quarter; 6.77% as of December 31, 2007
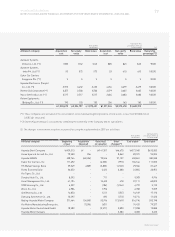
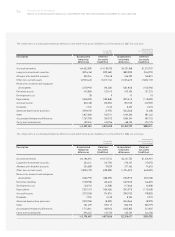
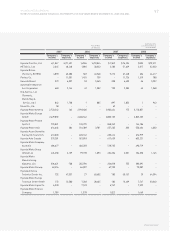
15. LONG-TERM DEBT AND DEBENTURES:
Long-term debt and debentures as of December 31, 2007 and 2006 consist of the following: