Hyundai 2007 Annual Report Download - page 60
Download and view the complete annual report
Please find page 60 of the 2007 Hyundai annual report below. You can navigate through the pages in the report by either clicking on the pages listed below, or by using the keyword search tool below to find specific information within the annual report.-
 1
1 -
2
-
3
-
4
-
5
-
6
-
7
-
8
-
9
-
10
-
11
-
12
-
13
-
14
-
15
-
16
-
17
-
18
-
19
-
20
-
21
-
22
-
23
-
24
-
25
-
26
-
27
-
28
-
29
-
30
-
31
-
32
-
33
-
34
-
35
-
36
-
37
-
38
-
39
-
40
-
41
-
42
-
43
-
44
-
45
-
46
-
47
-
48
-
49
-
 50
50 -
 51
51 -
 52
52 -
 53
53 -
 54
54 -
 55
55 -
 56
56 -
 57
57 -
 58
58 -
 59
59 -
 60
60 -
 61
61 -
 62
62 -
 63
63 -
 64
64 -
 65
65 -
 66
66 -
 67
67 -
 68
68 -
 69
69 -
 70
70 -
71
-
72
-
73
-
74
-
75
-
76
-
77
-
78
-
79
-
80
-
81
-
82
-
83
-
84
-
85
-
86
-
87
-
88
-
89
-
90
-
91
-
92
-
93
-
94
-
95
-
96
-
97
-
98
-
99
-
100
-
101
-
102
-
103
-
104
-
105
-
106
-
107
-
108
-
109
-
110
-
111
-
112
-
113
-
114
-
115
-
116
-
117
-
118
-
119
-
120
-
121
-
122
-
123
-
124
 |
 |

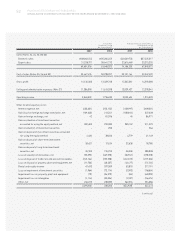
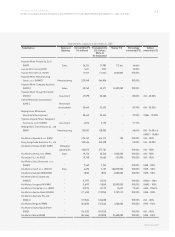
58 HYUNDAI MOTOR COMPANY AND SUBSIDIARIES
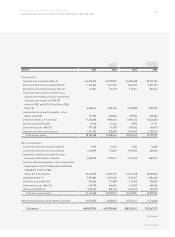
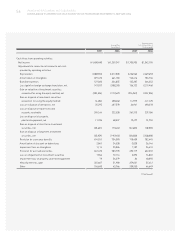
CONSOLIDATED STATEMENTS OF CASH FLOWS (CONTINUED)
FOR THE YEARS ENDED DECEMBER 31, 2007 AND 2006
2007 2006 2007 2006
Cash flows from investing activities:
Cash outflows from investing activities:
Purchase of short-term financial instruments (5,361,824) (3,603,095) $(5,715,012) $(3,840,434)
Acquisition of short-term investment securities (74,791) (388,915) (79,718) (414,533)
Acquisition of long-term investment securities (246,472) (1,493,177) (262,707) (1,591,534)
Acquisition of investment securities
using the equity method (200,311) (284,663) (213,506) (303,414)
Acquisition of property, plant and equipment (4,381,097) (3,869,386) (4,669,683) (4,124,266)
Expenditures for development costs (983,694) (824,966) (1,048,491) (879,307)
Additions to other current assets (44,091) (33,832) (46,995) (36,061)
Increase in other financial business assets (5,475,113) (3,984,502) (5,835,763) (4,246,964)
Decrease in other financial business liabilities - (191,867) - (204,505)
Additions to other assets (564,148) (552,012) (601,309) (588,374)
(17,331,541) (15,226,415) (18,473,184) (16,229,392)
(10,683,135) (7,343,097) (11,386,842) (7,826,793)
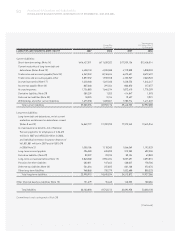
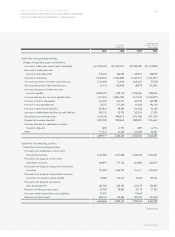
Cash flows from financing activities:
Cash inflows from financing activities:
Proceeds from short-term borrowings 24,645,526 24,621,505 26,268,947 26,243,344
Proceeds from long-term borrowings 3,820,629 3,162,505 4,072,297 3,370,822
Issuance of debentures 7,913,917 4,703,246 8,435,213 5,013,053
Proceeds from disposal of treasury stock 4,843 - 5,162 -
Paid in capital increase 137,152 271,825 146,186 289,730
Others 363,348 541,906 387,282 577,602
36,885,415 33,300,987 39,315,087 35,494,551
Cash outflows from financing activities:
Repayment of short-term borrowings (19,857,777) (24,837,515) (21,165,825) (26,473,582)
Repayment of debenture (2,859,202) (201,303) (3,047,540) (214,563)
Payment of cash dividends (349,782) (381,613) (372,822) (406,750)
Purchase of treasury stock (11,683) - (12,453) -
Repayment of current maturities of long-term debt (4,965,827) (4,358,241) (5,292,930) (4,645,322)
Others (108,796) (91,670) (115,962) (97,709)
(28,153,067) (29,870,342) (30,007,532) (31,837,926)
8,732,348 3,430,645 9,307,555 3,656,625
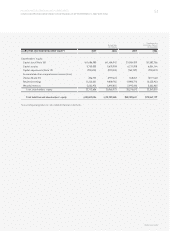
Effect of exchange rate on cash and cash equivalents,
beginning of year 88,385 (42,514) 94,207 (45,314)
Effect of change in consolidated subsidiaries 36,710 53,920 39,128 57,472
Net increase (decrease) in cash and cash equivalents 663,685 (667,801) 707,402 (711,789)
Cash and cash equivalents, beginning of year 3,730,007 4,397,808 3,975,706 4,687,495
Cash and cash equivalents, end of year 4,393,692 3,730,007 $4,683,108 $3,975,706
See accompanying notes to consolidated financial statements.
Korean Won
(In millions)
Translation into
U.S. Dollars (Note 2)
(In thousands)