Hyundai 2007 Annual Report Download - page 120
Download and view the complete annual report
Please find page 120 of the 2007 Hyundai annual report below. You can navigate through the pages in the report by either clicking on the pages listed below, or by using the keyword search tool below to find specific information within the annual report.-
 1
1 -
2
-
3
-
4
-
5
-
6
-
7
-
8
-
9
-
10
-
11
-
12
-
13
-
14
-
15
-
16
-
17
-
18
-
19
-
20
-
21
-
22
-
23
-
24
-
25
-
26
-
27
-
28
-
29
-
30
-
31
-
32
-
33
-
34
-
35
-
36
-
37
-
38
-
39
-
40
-
41
-
42
-
43
-
44
-
45
-
46
-
47
-
48
-
49
-
50
-
51
-
52
-
53
-
54
-
55
-
56
-
57
-
58
-
59
-
60
-
61
-
62
-
63
-
64
-
65
-
66
-
67
-
68
-
69
-
70
-
71
-
72
-
73
-
74
-
75
-
76
-
77
-
78
-
79
-
80
-
81
-
82
-
83
-
84
-
85
-
86
-
87
-
88
-
89
-
90
-
91
-
92
-
93
-
94
-
95
-
96
-
97
-
98
-
99
-
100
-
101
-
102
-
103
-
104
-
105
-
106
-
107
-
108
-
109
-
 110
110 -
 111
111 -
 112
112 -
 113
113 -
 114
114 -
 115
115 -
 116
116 -
 117
117 -
 118
118 -
 119
119 -
 120
120 -
 121
121 -
 122
122 -
 123
123 -
 124
124
 |
 |

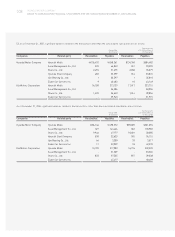
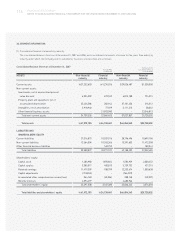
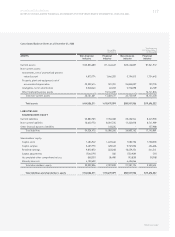
118 HYUNDAI MOTOR COMPANY
NOTES TO CONSOLIDATED FINANCIAL STATEMENTS FOR THE YEARS ENDED DECEMBER 31, 2007 AND 2006
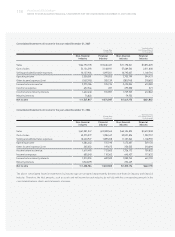
Consolidated Statements of Income for the year ended December 31, 2007
Korean Won
(In millions)
Translation into
U.S. Dollars (Note 2)
(In thousands)
Non-financial Financial Non-financial Financial
industry industry industry industry
Sales 66,790,778 3,636,487 $71,190,341 $3,876,025
Cost of sales 54,124,293 2,168,931 57,689,504 2,311,800
Selling and administrative expenses 10,127,904 1,097,501 10,795,037 1,169,794
Operating income 2,538,581 370,055 2,705,799 394,431
Other income (expenses), net (263,395) 205,139 (280,745) 218,652
Income before income tax 2,275,186 575,194 2,425,054 613,082
Income tax expense 652,546 207 695,530 221
Income before minority interests 1,622,640 574,987 1,729,525 612,862
Minority interests 74,823 - 79,752 -
Net income 1,547,817 574,987 $1,649,773 $621,862
Consolidated Statements of Income for the year ended December 31, 2006
Korean Won
(In millions)
Translation into
U.S. Dollars (Note 2)
(In thousands)
Non-financial Financial Non-financial Financial
industry industry industry industry
Sales 61,081,347 3,389,565 $65,104,825 $3,612,838
Cost of sales 49,275,977 1,785,167 52,521,826 1,902,757
Selling and administrative expenses 10,420,927 1,089,208 11,107,362 1,160,955
Operating income 1,384,443 515,190 1,475,637 549,126
Other income (expenses), net 235,052 197,675 250,535 210,696
Income before income tax 1,619,495 712,865 1,726,172 759,822
Income tax expense 605,540 110,362 645,427 117,632
Income before minority interests 1,013,955 602,503 1,080,745 642,190
Minority interests (236,829) - 252,429 -
Net income 1,250,784 602,503 $1,333,174 $642,190
The above consolidated financial statements by industry type are prepared independently between non-financial industry and financial
industry. Therefore, the total amounts, such as assets and net income for each industry, do not tally with the corresponding amounts in the
consolidated balance sheets and statements of income.