Hyundai 2007 Annual Report Download - page 86
Download and view the complete annual report
Please find page 86 of the 2007 Hyundai annual report below. You can navigate through the pages in the report by either clicking on the pages listed below, or by using the keyword search tool below to find specific information within the annual report.-
 1
1 -
2
-
3
-
4
-
5
-
6
-
7
-
8
-
9
-
10
-
11
-
12
-
13
-
14
-
15
-
16
-
17
-
18
-
19
-
20
-
21
-
22
-
23
-
24
-
25
-
26
-
27
-
28
-
29
-
30
-
31
-
32
-
33
-
34
-
35
-
36
-
37
-
38
-
39
-
40
-
41
-
42
-
43
-
44
-
45
-
46
-
47
-
48
-
49
-
50
-
51
-
52
-
53
-
54
-
55
-
56
-
57
-
58
-
59
-
60
-
61
-
62
-
63
-
64
-
65
-
66
-
67
-
68
-
69
-
70
-
71
-
72
-
73
-
74
-
75
-
 76
76 -
 77
77 -
 78
78 -
 79
79 -
 80
80 -
 81
81 -
 82
82 -
 83
83 -
 84
84 -
 85
85 -
 86
86 -
 87
87 -
 88
88 -
 89
89 -
 90
90 -
 91
91 -
 92
92 -
 93
93 -
 94
94 -
 95
95 -
 96
96 -
97
-
98
-
99
-
100
-
101
-
102
-
103
-
104
-
105
-
106
-
107
-
108
-
109
-
110
-
111
-
112
-
113
-
114
-
115
-
116
-
117
-
118
-
119
-
120
-
121
-
122
-
123
-
124
 |
 |

84 HYUNDAI MOTOR COMPANY
NOTES TO CONSOLIDATED FINANCIAL STATEMENTS FOR THE YEARS ENDED DECEMBER 31, 2007 AND 2006
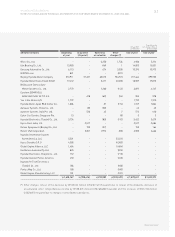
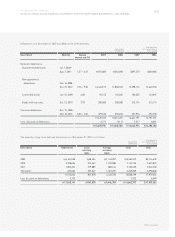
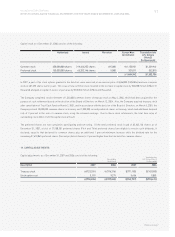
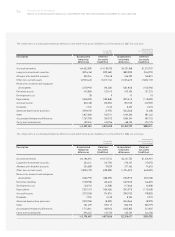
The changes in property, plant and equipment in 2007 are as follows:
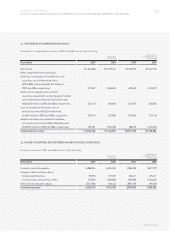
10. PROPERTY, PLANT AND EQUIPMENT:
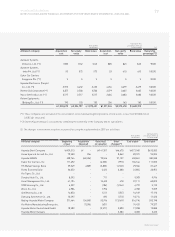
Property, plant and equipments as of December 31, 2007 and 2006 consist of the following:
Korean Won
(In millions)
Translation into
U.S. Dollars (Note 2)
(In thousands)
Description 2007 2006 2007 2006
Buildings and structures 8,869,028 7,531,889 $9,453,238 $8,028,021
Machinery and equipment 15,482,215 12,353,513 16,502,041 13,167,249
Vehicles 237,741 189,863 253,401 202,369
Tools, dies and molds 5,260,327 3,570,875 5,606,829 3,806,091
Other equipment 1,766,788 1,424,757 1,883,168 1,518,607
31,616,099 25,070,897 33,698,677 26,722,337
Less: accumulated depreciation 13,277,036 8,348,614 14,151,605 8,898,544
18,339,063 16,722,283 19,547,072 17,823,793
Land 4,343,188 4,262,913 4,629,277 4,543,715
Construction in progress 2,947,279 2,506,397 3,141,419 2,671,495
25,629,530 23,491,593 $27,317,768 $25,039,003
Translation into
U.S. Dollars (Note 2)
(In thousands)
Korean Won
(In millions)
Beginning Acquisition Transfer Disposal Depreciation Other(*) End of End of
of year year year
Land 4,262,913 7,782 83,895 (20,507) (2,696) 11,801 4,343,188 $4,629,277
Buildings and structures 6,380,955 302,385 638,398 (42,896) (263,790) 56,342 7,071,394 7,537,192
Machinery and equipment 8,196,382 811,701 1,407,914 (302,625) (1,155,019) 136,218 9,094,571 9,693,638
Vehicles 122,038 30,823 33,487 (27,072) (36,108) 2,972 126,140 134,449
Tools, dies and molds 1,369,674 49,276 539,150 (7,072) (432,435) (3,993) 1,514,600 1,614,368
Other equipment 653,234 120,437 106,689 (6,769) (198,912) (142,321) 532,358 567,425
Construction in progress 2,506,397 3,058,693 (2,809,533) (11,548) - 203,270 2,947,279 3,141,419
23,491,593 4,381,097 -(418,489) (2,088,960) 264,289 25,629,530 $27,317,768
(*) Other includes foreign currency adjustment, changes in the scope of consolidation, impairment loss and transfer to other assets.