Hyundai 2007 Annual Report Download - page 119
Download and view the complete annual report
Please find page 119 of the 2007 Hyundai annual report below. You can navigate through the pages in the report by either clicking on the pages listed below, or by using the keyword search tool below to find specific information within the annual report.-
 1
1 -
2
-
3
-
4
-
5
-
6
-
7
-
8
-
9
-
10
-
11
-
12
-
13
-
14
-
15
-
16
-
17
-
18
-
19
-
20
-
21
-
22
-
23
-
24
-
25
-
26
-
27
-
28
-
29
-
30
-
31
-
32
-
33
-
34
-
35
-
36
-
37
-
38
-
39
-
40
-
41
-
42
-
43
-
44
-
45
-
46
-
47
-
48
-
49
-
50
-
51
-
52
-
53
-
54
-
55
-
56
-
57
-
58
-
59
-
60
-
61
-
62
-
63
-
64
-
65
-
66
-
67
-
68
-
69
-
70
-
71
-
72
-
73
-
74
-
75
-
76
-
77
-
78
-
79
-
80
-
81
-
82
-
83
-
84
-
85
-
86
-
87
-
88
-
89
-
90
-
91
-
92
-
93
-
94
-
95
-
96
-
97
-
98
-
99
-
100
-
101
-
102
-
103
-
104
-
105
-
106
-
107
-
108
-
 109
109 -
 110
110 -
 111
111 -
 112
112 -
 113
113 -
 114
114 -
 115
115 -
 116
116 -
 117
117 -
 118
118 -
 119
119 -
 120
120 -
 121
121 -
 122
122 -
 123
123 -
 124
124
 |
 |

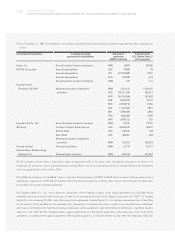
117
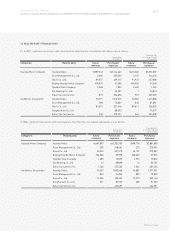
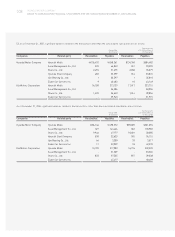
HYUNDAI MOTOR COMPANY
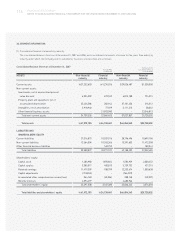
NOTES TO CONSOLIDATED FINANCIAL STATEMENTS FOR THE YEARS ENDED DECEMBER 31, 2007 AND 2006
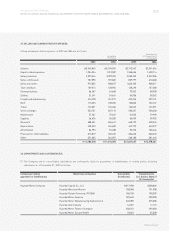
Consolidated Balance Sheets as of December 31, 2006
Korean Won
(In millions)
Translation into
U.S. Dollars (Note 2)
(In thousands)
ASSETS Non-financial Financial Non-financial Financial
industry industry industry industry
Current assets: 23,854,680 1,446,622 $25,426,007 $1,541,912
Non-current assets:
Investments, net of unamortized present
value discount 4,873,774 1,646,205 5,194,813 1,754,642
Property, plant and equipment, net of
accumulated depreciation 23,309,614 181,781 24,845,037 193,755
Intangibles, net of amortization 2,548,243 60,222 2,716,098 64,189
Other financial business assets - 15,144,269 - 16,141,834
Total non-current assets 30,731,631 17,032,477 32,755,949 18,154,420
Total assets 54,586,311 18,479,099 $58,181,956 $19,696,332
LIABILITIES AND
SHAREHOLDERS’ EQUITY
Current liabilities 23,883,705 7,736,308 25,456,944 8,245,905
Non-current liabilities 10,642,770 8,201,734 11,343,818 8,741,989
Other financial business liabilities - 148,224 - 157,988
Total liabilities 34,526,475 16,086,266 36,800,762 17,145,881
Shareholders’ equity:
Capital stock 1,484,942 1,649,640 1,582,756 1,758,303
Capital surplus 5,405,773 428,463 5,761,856 456,686
Retained earnings 9,812,872 323,248 10,459,254 344,541
Capital adjustments (706,379) (20) (752,909) (21)
Accumulated other comprehensive loss (88,031) (8,498) (93,830) (9,058)
Minority interests 4,150,659 - 4,424,066 -
Total shareholders’ equity 20,059,836 2,392,833 21,381,194 2,550,451
Total liabilities and shareholders’ equity 54,586,311 18,479,099 $58,181,956 $19,696,332