Hyundai 2007 Annual Report Download - page 54
Download and view the complete annual report
Please find page 54 of the 2007 Hyundai annual report below. You can navigate through the pages in the report by either clicking on the pages listed below, or by using the keyword search tool below to find specific information within the annual report.-
 1
1 -
2
-
3
-
4
-
5
-
6
-
7
-
8
-
9
-
10
-
11
-
12
-
13
-
14
-
15
-
16
-
17
-
18
-
19
-
20
-
21
-
22
-
23
-
24
-
25
-
26
-
27
-
28
-
29
-
30
-
31
-
32
-
33
-
34
-
35
-
36
-
37
-
38
-
39
-
40
-
41
-
42
-
43
-
 44
44 -
 45
45 -
 46
46 -
 47
47 -
 48
48 -
 49
49 -
 50
50 -
 51
51 -
 52
52 -
 53
53 -
 54
54 -
 55
55 -
 56
56 -
 57
57 -
 58
58 -
 59
59 -
 60
60 -
 61
61 -
 62
62 -
 63
63 -
 64
64 -
65
-
66
-
67
-
68
-
69
-
70
-
71
-
72
-
73
-
74
-
75
-
76
-
77
-
78
-
79
-
80
-
81
-
82
-
83
-
84
-
85
-
86
-
87
-
88
-
89
-
90
-
91
-
92
-
93
-
94
-
95
-
96
-
97
-
98
-
99
-
100
-
101
-
102
-
103
-
104
-
105
-
106
-
107
-
108
-
109
-
110
-
111
-
112
-
113
-
114
-
115
-
116
-
117
-
118
-
119
-
120
-
121
-
122
-
123
-
124
 |
 |

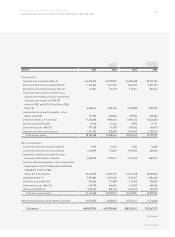
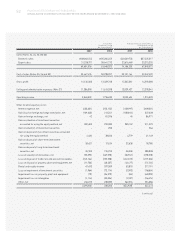
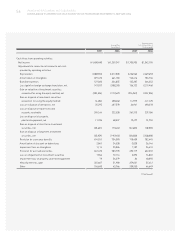
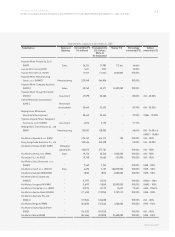
52 HYUNDAI MOTOR COMPANY AND SUBSIDIARIES
CONSOLIDATED STATEMENTS OF INCOME FOR THE YEARS ENDED DECEMBER 31, 2007 AND 2006
Korean Won
(In millions, except
per share amounts)
Translation into U.S. Dollars (Note 2)
(In thousands, except
per share amounts)
2007 2006 2007 2006
Sales (Notes 24, 25, 26 and 30)
Domestic sales 38,062,545 35,206,252 $40,569,756 $37,525,317
Export sales 31,538,971 28,441,773 33,616,469 30,315,255
69,601,516 63,648,025 74,186,225 67,840,572
Cost of sales (Notes 25, 26 and 30) 55,467,476 50,238,257 59,121,164 53,547,492
Gross profit 14,134,040 13,409,768 15,065,061 14,293,080
Selling and administrative expenses (Note 27) 11,286,018 11,613,078 12,029,437 12,378,041
Operating income 2,848,022 1,796,690 3,035,624 1,915,039
Other income (expenses), net:
Interest expense, net (430,631) (253,155) (458,997) (269,831)
Gain (loss) on foreign exchange translation, net (169,640) 213,561 (180,814) 227,628
Gain on foreign exchange, net 42 81,596 45 86,971
Gain on valuation of investment securities
accounted for using the equity method, net 281,603 292,089 300,152 311,329
Gain on valuation of investment securities - 250 - 266
Gain on disposal of investment securities accounted
for using the equity method 4,484 38,606 4,779 41,149
Gain on disposal of short-term investment
securities, net 30,621 17,624 32,638 18,785
Gain on disposal of long-term investment
securities, net 35,959 195,922 38,328 208,828
Loss on valuation of derivatives, net (25,295) (467,578) (26,961) (498,378)
Loss on disposal of trade note and account receivables (245,164) (222,528) (261,313) (237,186)
Loss on disposal of property, plant and equipment, net (11,706) (48,537) (12,477) (51,734)
Rental and royalty income 47,670 297,589 50,810 317,191
Loss on impairment of investment securities (1,964) (72,114) (2,093) (76,864)
Impairment loss on property, plant and equipment (79) (56,379) (84) (60,093)
Impairment loss on intangibles (1,114) (25,026) (1,187) (26,674)
Other, net 246,012 238,383 262,216 254,086
(239,202) 230,303 (254,958) 245,473
(continued)