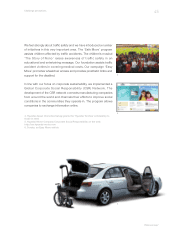
Hyundai 2007 Annual Report Download - page 57
Download and view the complete annual report
Please find page 57 of the 2007 Hyundai annual report below. You can navigate through the pages in the report by either clicking on the pages listed below, or by using the keyword search tool below to find specific information within the annual report.-
 1
1 -
2
-
3
-
4
-
5
-
6
-
7
-
8
-
9
-
10
-
11
-
12
-
13
-
14
-
15
-
16
-
17
-
18
-
19
-
20
-
21
-
22
-
23
-
24
-
25
-
26
-
27
-
28
-
29
-
30
-
31
-
32
-
33
-
34
-
35
-
36
-
37
-
38
-
39
-
40
-
41
-
42
-
43
-
44
-
45
-
46
-
 47
47 -
 48
48 -
 49
49 -
 50
50 -
 51
51 -
 52
52 -
 53
53 -
 54
54 -
 55
55 -
 56
56 -
 57
57 -
 58
58 -
 59
59 -
 60
60 -
 61
61 -
 62
62 -
 63
63 -
 64
64 -
 65
65 -
 66
66 -
 67
67 -
68
-
69
-
70
-
71
-
72
-
73
-
74
-
75
-
76
-
77
-
78
-
79
-
80
-
81
-
82
-
83
-
84
-
85
-
86
-
87
-
88
-
89
-
90
-
91
-
92
-
93
-
94
-
95
-
96
-
97
-
98
-
99
-
100
-
101
-
102
-
103
-
104
-
105
-
106
-
107
-
108
-
109
-
110
-
111
-
112
-
113
-
114
-
115
-
116
-
117
-
118
-
119
-
120
-
121
-
122
-
123
-
124
 |
 |

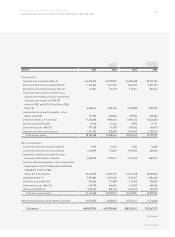
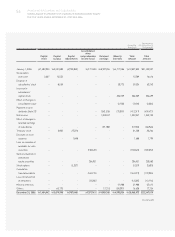
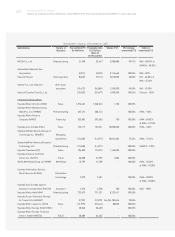
55
HYUNDAI MOTOR COMPANY AND SUBSIDIARIES
CONSOLIDATED STATEMENTS OF CHANGES IN SHAREHOLDERS’ EQUITY (CONTINUED)
FOR THE YEARS ENDED DECEMBER 31, 2007 AND 2006
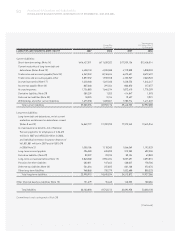
Accumulated
other
Capital Capital Capital comprehensive Retained Minority Total Total
stock surplus adjustments income (loss) earnings interests amount amount
January 1, 2007 1,484,942 5,679,998 (707,045) (297,541) 9,809,765 4,995,854 20,965,973 $22,347,019
Stock option
exercised 2,038 13,552 (4,152) - - - 11,438 12,191
Disposal of treasury
stock - 17,358 - - - - 17,358 18,501
Disposal of
subsidiaries’ stock - (8,095) - - 53,422 88,136 133,463 142,254
Increase in
subsidiaries’
capital-stock - 10,871 - - - 156,543 167,414 178,442
Subsidiaries’ sale of
assets - 21,573 - - (24,449) 2,876 - -
Effect of changes in
consolidation
scope - - - - - 57,400 57,400 61,181
Payment of cash
dividends (Note 23) - - - - (275,373) (74,409) (349,782) (372,822)
Net income - - - - 1,600,480 1,600,480 1,705,905
Treasury stock - - (7,208) - - - (7,208) (7,683)
Gain on valuation of
available-for-sale
securities - - - 571,817 - - 571,817 609,483
Loss on valuation of
investment equity
securities - - - (63,121) - - (63,121) (67,279)
Cumulative
translation debits - - - 169,091 - - 169,091 180,229
Loss on transaction
of derivatives - - - (53,521) - - (53,521) (57,046)
Minority interests - - - - - 355,607 355,607 379,031
Others - 17,746 - - 76,516 42,965 137,227 146,267
December 31, 2007 1,486,980 5,753,003 (718,405) 326,725 11,240,361 5,624,972 23,713,636 $25,275,673
See accompanying notes to consolidated financial statements.
Korean Won
(In millions)
Translation into
U.S. Dollars (Note 2)
(In thousands)