Dish Network 2014 Annual Report Download - page 81
Download and view the complete annual report
Please find page 81 of the 2014 Dish Network annual report below. You can navigate through the pages in the report by either clicking on the pages listed below, or by using the keyword search tool below to find specific information within the annual report.-
 1
1 -
2
-
3
-
4
-
5
-
6
-
7
-
8
-
9
-
10
-
11
-
12
-
13
-
14
-
15
-
16
-
17
-
18
-
19
-
20
-
21
-
22
-
23
-
24
-
25
-
26
-
27
-
28
-
29
-
30
-
31
-
32
-
33
-
34
-
35
-
36
-
37
-
38
-
39
-
40
-
41
-
42
-
43
-
44
-
45
-
46
-
47
-
48
-
49
-
50
-
51
-
52
-
53
-
54
-
55
-
56
-
57
-
58
-
59
-
60
-
61
-
62
-
63
-
64
-
65
-
66
-
67
-
68
-
69
-
70
-
 71
71 -
 72
72 -
 73
73 -
 74
74 -
 75
75 -
 76
76 -
 77
77 -
 78
78 -
 79
79 -
 80
80 -
 81
81 -
 82
82 -
 83
83 -
 84
84 -
 85
85 -
 86
86 -
 87
87 -
 88
88 -
 89
89 -
 90
90 -
 91
91 -
92
-
93
-
94
-
95
-
96
-
97
-
98
-
99
-
100
-
101
-
102
-
103
-
104
-
105
-
106
-
107
-
108
-
109
-
110
-
111
-
112
-
113
-
114
-
115
-
116
-
117
-
118
-
119
-
120
-
121
-
122
-
123
-
124
-
125
-
126
-
127
-
128
-
129
-
130
-
131
-
132
-
133
-
134
-
135
-
136
-
137
-
138
-
139
-
140
-
141
-
142
-
143
-
144
-
145
-
146
-
147
-
148
-
149
-
150
-
151
-
152
-
153
-
154
-
155
-
156
-
157
-
158
-
159
-
160
-
161
-
162
-
163
-
164
-
165
-
166
-
167
-
168
-
169
-
170
-
171
-
172
-
173
-
174
-
175
-
176
-
177
-
178
-
179
-
180
-
181
-
182
-
183
-
184
-
185
-
186
-
187
-
188
 |
 |

Item 7. MANAGEMENT’S DISCUSSION AND ANALYSIS OF FINANCIAL CONDITION AND
RESULTS OF OPERATIONS - Continued
71
71
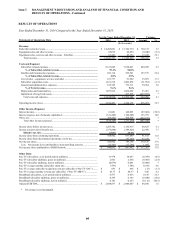
offset by a decrease in transponder capacity leased from EchoStar primarily related to the expiration of the EchoStar
VI lease in the first quarter 2013.
Subscriber acquisition costs. “Subscriber acquisition costs” totaled $1.843 billion for the year ended December 31,
2013, an increase of $156 million or 9.2% compared to the same period in 2012. This change was primarily
attributable to an increase in expense related to our Broadband subscriber activations and an increase in Pay-TV SAC
described below, partially offset by a decrease in gross new Pay-TV subscriber activations. Included in “Subscriber
acquisition costs” was $154 million and $46 million of expenses related to our broadband services for the years ended
December 31, 2013 and 2012, respectively.
Pay-TV SAC. Pay-TV SAC was $866 during the year ended December 31, 2013 compared to $784 during the same
period in 2012, an increase of $82 or 10.5%. This increase was primarily attributable to increased equipment and
advertising costs. Capitalized equipment costs increased primarily due to an increase in the percentage of new
subscriber activations with Hopper receiver systems. In addition, the second-generation Hopper set-top box cost per
unit is currently higher than the original Hopper set-top box. Advertising costs increased due to brand spending
related to the launch of our new second-generation Hopper set-top box in February 2013.
During the years ended December 31, 2013 and 2012, the amount of equipment capitalized under our lease program
for new Pay-TV subscribers totaled $621 million and $506 million, respectively. This increase in capital expenditures
under our lease program for new Pay-TV subscribers resulted primarily from the factors described above.
Our Pay-TV SAC calculation does not reflect any benefit from payments we received in connection with equipment
not returned to us from disconnecting lease subscribers and returned equipment that is made available for sale or
used in our existing customer lease program rather than being redeployed through our new customer lease program.
During the years ended December 31, 2013 and 2012, these amounts totaled $135 million and $140 million,
respectively.
General and administrative expenses. “General and administrative expenses” totaled $777 million during the year
ended December 31, 2013, a $55 million or 7.6% increase compared to the same period in 2012. This increase was
primarily driven by legal and financial advisory fees related to our merger and acquisition activities.
Litigation expense. “Litigation expense” related to the Voom Settlement Agreement totaled $730 million during the
year ended December 31, 2012.
Depreciation and amortization. “Depreciation and amortization” expense totaled $1.054 billion during the year ended
December 31, 2013, a $90 million or 9.3% increase compared to the same period in 2012. This change in
“Depreciation and amortization” expense was primarily due to $53 million of additional depreciation expense as a
result of the accelerated depreciable lives of certain assets designed to support the TerreStar MSS business, which
ceased operations during the second quarter 2013, and increased depreciation expense from equipment leased to
subscribers primarily related to subscriber activations with new Hopper receiver systems. The expense in 2012 was
impacted by the $68 million of depreciation expense related to the 148 degree orbital location.
Impairment of long-lived assets. “Impairment of long-lived assets” of $438 million during the year ended
December 31, 2013 resulted from an impairment of the T2 and D1 satellites during the second quarter 2013. See
Note 8 in the Notes to our Consolidated Financial Statements in this Annual Report on Form 10-K for further
information.
Interest income. “Interest income” totaled $149 million during the year ended December 31, 2013, an increase of $50
million compared to the same period in 2012. This increase primarily resulted from higher average cash and
marketable investment securities balances and higher percentage returns earned on our cash and marketable investment
securities during the year ended December 31, 2013.
Interest expense, net of amounts capitalized. “Interest expense, net of amounts capitalized” totaled $745 million
during year ended December 31, 2013, an increase of $209 million or 38.9% compared to the same period in 2012.
This change primarily resulted from an increase in interest expense associated with the issuance of debt during 2013
and 2012 partially offset by the redemption of debt during 2013 and a $30 million increase in capitalized interest in