Dish Network 2014 Annual Report Download - page 80
Download and view the complete annual report
Please find page 80 of the 2014 Dish Network annual report below. You can navigate through the pages in the report by either clicking on the pages listed below, or by using the keyword search tool below to find specific information within the annual report.-
 1
1 -
2
-
3
-
4
-
5
-
6
-
7
-
8
-
9
-
10
-
11
-
12
-
13
-
14
-
15
-
16
-
17
-
18
-
19
-
20
-
21
-
22
-
23
-
24
-
25
-
26
-
27
-
28
-
29
-
30
-
31
-
32
-
33
-
34
-
35
-
36
-
37
-
38
-
39
-
40
-
41
-
42
-
43
-
44
-
45
-
46
-
47
-
48
-
49
-
50
-
51
-
52
-
53
-
54
-
55
-
56
-
57
-
58
-
59
-
60
-
61
-
62
-
63
-
64
-
65
-
66
-
67
-
68
-
69
-
 70
70 -
 71
71 -
 72
72 -
 73
73 -
 74
74 -
 75
75 -
 76
76 -
 77
77 -
 78
78 -
 79
79 -
 80
80 -
 81
81 -
 82
82 -
 83
83 -
 84
84 -
 85
85 -
 86
86 -
 87
87 -
 88
88 -
 89
89 -
 90
90 -
91
-
92
-
93
-
94
-
95
-
96
-
97
-
98
-
99
-
100
-
101
-
102
-
103
-
104
-
105
-
106
-
107
-
108
-
109
-
110
-
111
-
112
-
113
-
114
-
115
-
116
-
117
-
118
-
119
-
120
-
121
-
122
-
123
-
124
-
125
-
126
-
127
-
128
-
129
-
130
-
131
-
132
-
133
-
134
-
135
-
136
-
137
-
138
-
139
-
140
-
141
-
142
-
143
-
144
-
145
-
146
-
147
-
148
-
149
-
150
-
151
-
152
-
153
-
154
-
155
-
156
-
157
-
158
-
159
-
160
-
161
-
162
-
163
-
164
-
165
-
166
-
167
-
168
-
169
-
170
-
171
-
172
-
173
-
174
-
175
-
176
-
177
-
178
-
179
-
180
-
181
-
182
-
183
-
184
-
185
-
186
-
187
-
188
 |
 |
Item 7. MANAGEMENT’S DISCUSSION AND ANALYSIS OF FINANCIAL CONDITION AND
RESULTS OF OPERATIONS - Continued
70
70
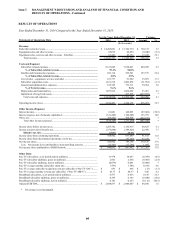
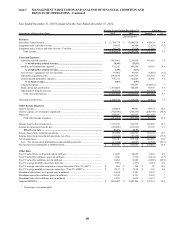
Pay-TV subscribers. DISH added approximately 1,000 net Pay-TV subscribers during the year ended December 31,
2013, compared to the addition of approximately 89,000 net Pay-TV subscribers during the same period in 2012.
The decrease versus the same period in 2012 primarily resulted from lower gross new Pay-TV subscriber
activations. During the year ended December 31, 2013, DISH activated approximately 2.666 million gross new
Pay-TV subscribers compared to approximately 2.739 million gross new Pay-TV subscribers during the same period
in 2012, a decrease of 2.7%. Our gross new Pay-TV subscriber activations continue to be negatively impacted by
increased competitive pressures, including aggressive marketing, discounted promotional offers, and more
aggressive retention efforts in a mature market. In addition, our gross new Pay-TV subscriber activations continue
to be adversely affected by sustained economic weakness and uncertainty.
Our Pay-TV churn rate for the year ended December 31, 2013 was 1.58% compared to 1.57% for the same period in
2012. Our Pay-TV churn rate was negatively impacted in part because we increased our programming package
price in the first quarter 2013 and did not during the same period in 2012. Churn continues to be adversely affected
by increased competitive pressures, including aggressive marketing and discounted promotional offers. Our Pay-TV
churn rate is also impacted by, among other things, the credit quality of previously acquired subscribers, our ability
to consistently provide outstanding customer service, price increases, programming interruptions driven by contract
disputes, and our ability to control piracy and other forms of fraud.
Broadband subscribers. DISH added approximately 253,000 net Broadband subscribers during the year ended
December 31, 2013 compared to the addition of approximately 78,000 net Broadband subscribers during the same
period in 2012. This increase versus the same period in 2012 primarily resulted from higher gross new Broadband
subscriber activations driven by increased advertising associated with the launch of dishNET branded broadband
services on September 27, 2012. During the year ended December 31, 2013, DISH activated approximately 343,000
gross new Broadband subscribers compared to the activation of approximately 121,000 gross new Broadband
subscribers during the same period in 2012. This increase was driven by increased advertising associated with the
launch of dishNET branded broadband services on September 27, 2012. Broadband services revenue was $221
million and $95 million for the years ended December 31, 2013 and 2012, respectively, representing 1.6% and 0.7%
of our total “Subscriber-related revenue,” respectively.
Subscriber-related revenue. “Subscriber-related revenue” totaled $13.765 billion for the year ended December 31,
2013, an increase of $700 million or 5.4% compared to the same period in 2012. The change in “Subscriber-related
revenue” from the same period in 2012 was primarily related to the increase in Pay-TV ARPU discussed below and
revenue from broadband services. Included in “Subscriber-related revenue” was $221 million and $95 million of
revenue related to our broadband services for the years ended December 31, 2013 and 2012, respectively.
Pay-TV ARPU. Pay-TV ARPU was $80.37 during the year ended December 31, 2013 versus $76.98 during the same
period in 2012. The $3.39 or 4.4% increase in Pay-TV ARPU was primarily attributable to the programming package
price increase in February 2013 and higher hardware related revenue.
Subscriber-related expenses. “Subscriber-related expenses” totaled $7.818 billion during the year ended December
31, 2013, an increase of $564 million or 7.8% compared to the same period in 2012. The increase in “Subscriber-
related expenses” was primarily attributable to higher pay-TV programming costs and higher Broadband subscriber-
related expenses due to the increase in our Broadband subscriber base. The increase in programming costs was driven
by rate increases in certain of our programming contracts, including the renewal of certain contracts at higher rates.
Included in “Subscriber-related expenses” was $143 million and $51 million of expense related to our broadband
services for the years ended December 31, 2013 and 2012, respectively. “Subscriber-related expenses” represented
56.8% and 55.5% of “Subscriber-related revenue” during the years ended December 31, 2013 and 2012, respectively.
The change in this expense to revenue ratio primarily resulted from higher pay-TV programming costs, discussed
above.
Satellite and transmission expenses. “Satellite and transmission expenses” totaled $536 million during the year ended
December 31, 2013, an increase of $69 million or 14.9% compared to the same period in 2012. The increase in
“Satellite and transmission expenses” is primarily related to an increase in transponder capacity leased from
EchoStar primarily related to the EchoStar XVI satellite, which was launched in November 2012 and QuetzSat-1,
which commenced commercial operation at the 77 degree orbital slot in February 2013. This increase was partially