Dish Network 2014 Annual Report Download - page 172
Download and view the complete annual report
Please find page 172 of the 2014 Dish Network annual report below. You can navigate through the pages in the report by either clicking on the pages listed below, or by using the keyword search tool below to find specific information within the annual report.-
 1
1 -
2
-
3
-
4
-
5
-
6
-
7
-
8
-
9
-
10
-
11
-
12
-
13
-
14
-
15
-
16
-
17
-
18
-
19
-
20
-
21
-
22
-
23
-
24
-
25
-
26
-
27
-
28
-
29
-
30
-
31
-
32
-
33
-
34
-
35
-
36
-
37
-
38
-
39
-
40
-
41
-
42
-
43
-
44
-
45
-
46
-
47
-
48
-
49
-
50
-
51
-
52
-
53
-
54
-
55
-
56
-
57
-
58
-
59
-
60
-
61
-
62
-
63
-
64
-
65
-
66
-
67
-
68
-
69
-
70
-
71
-
72
-
73
-
74
-
75
-
76
-
77
-
78
-
79
-
80
-
81
-
82
-
83
-
84
-
85
-
86
-
87
-
88
-
89
-
90
-
91
-
92
-
93
-
94
-
95
-
96
-
97
-
98
-
99
-
100
-
101
-
102
-
103
-
104
-
105
-
106
-
107
-
108
-
109
-
110
-
111
-
112
-
113
-
114
-
115
-
116
-
117
-
118
-
119
-
120
-
121
-
122
-
123
-
124
-
125
-
126
-
127
-
128
-
129
-
130
-
131
-
132
-
133
-
134
-
135
-
136
-
137
-
138
-
139
-
140
-
141
-
142
-
143
-
144
-
145
-
146
-
147
-
148
-
149
-
150
-
151
-
152
-
153
-
154
-
155
-
156
-
157
-
158
-
159
-
160
-
161
-
 162
162 -
 163
163 -
 164
164 -
 165
165 -
 166
166 -
 167
167 -
 168
168 -
 169
169 -
 170
170 -
 171
171 -
 172
172 -
 173
173 -
 174
174 -
 175
175 -
 176
176 -
 177
177 -
 178
178 -
 179
179 -
 180
180 -
 181
181 -
 182
182 -
183
-
184
-
185
-
186
-
187
-
188
 |
 |

DISH NETWORK CORPORATION
NOTES TO CONSOLIDATED FINANCIAL STATEMENTS - Continued
F-66
(2) The year ended December 31, 2012 reflects Wireless results from the acquisitions of DBSD North America and
TerreStar on March 9, 2012 through December 31, 2012.
Geographic Information. Revenues are attributed to geographic regions based upon the location where the
products are delivered and services are provided. All revenue from continuing operations was derived from the
United States.
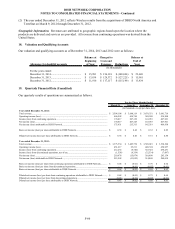
18. Valuation and Qualifying Accounts
Our valuation and qualifying accounts as of December 31, 2014, 2013 and 2012 were as follows:
Allowance for doubtful accounts
Balance at
Beginning
of Year
Charged to
Costs and
Expenses Deductions
Balance at
End of
Year
For the years ended:
December 31, 2014............................................. 15,981$ 156,318$ (148,696)$ 23,603$
December 31, 2013............................................. 13,834$ 129,372$ (127,225)$ 15,981$
December 31, 2012............................................. 11,916$ 117,117$ (115,199)$ 13,834$
(In thousands)
19. Quarterly Financial Data (Unaudited)
Our quarterly results of operations are summarized as follows:
March 31 June 30 September 30 December 31
Year ended December 31, 2014:
Total revenue....................................................................................................................................... 3,594,198$ 3,688,119$ 3,679,351$ 3,681,719$
Operating income (loss)...................................................................................................................... 446,298 454,744 388,509 534,900
Income (loss) from continuing operations........................................................................................... 170,817 207,129 143,035 407,921
Net income (loss)................................................................................................................................ 170,817 207,129 143,035 407,921
Net income (loss) attributable to DISH Network................................................................................ 175,931 213,313 145,519 409,930
Basic net income (loss) per share attributable to DISH Network........................................................ 0.38$ 0.46$ 0.32$ 0.89$
Diluted net income (loss) per share attributable to DISH Network..................................................... 0.38$ 0.46$ 0.31$ 0.88$
Year ended December 31, 2013:
Total revenue....................................................................................................................................... 3,375,530$ 3,485,774$ 3,505,021$ 3,538,540$
Operating income (loss)...................................................................................................................... 451,617 25,211 420,394 450,957
Income (loss) from continuing operations........................................................................................... 212,234 (8,720) 343,324 290,251
Income (loss) from discontinued operations, net of tax....................................................................... (1,558) (6,354) (32,334) (7,097)
Net income (loss)................................................................................................................................ 210,676 (15,074) 310,990 283,154
Net income (loss) attributable to DISH Network................................................................................ 215,598 (11,052) 314,908 288,038
Basic net income (loss) per share from continuing operations attributable to DISH Network............ 0.48$ (0.01)$ 0.76$ 0.64$
Basic net income (loss) per share from discontinued operations......................................................... - (0.01) (0.07) (0.01)
Basic net income (loss) per share attributable to DISH Network........................................................ 0.48$ (0.02)$ 0.69$ 0.63$
Diluted net income (loss) per share from continuing operations attributable to DISH Network......... 0.48$ (0.01)$ 0.75$ 0.64$
Diluted net income (loss) per share from discontinued operations...................................................... (0.01) (0.01) (0.07) (0.01)
Diluted net income (loss) per share attributable to DISH Network..................................................... 0.47$ (0.02)$ 0.68$ 0.63$
(In thousands, except per share data)
For the Three Months Ended